Setting up a Basemap and Overlaying Points from PostGIS
You commonly have some semi-proprietary datasource which you want to overlay onto another. This guide shows how to generate a basemap using Planetiler from OSM and overlay custom points from a PostGIS database. See here for a discussion on the pros and cons of this/alternative data sources.
Prerequisites
We expect you have the following already installed:
Generate an MBTiles basemap with Planetiler
There are multiple ways to generate a tile archive. For semi-static tile archives, we think using Planetiler to build MBtiles archives using OpenMapTiles is a good starting point.
🤔 Why do I need a tool to convert OSM to mbtiles in the first place? (click to expand)
The reason you need a tool to build vector tilesets from OpenStreetMap is that the data in OpenStreetMap is
- not following a specific schema,
- nor pre-tiled into
x/y/zchunks.
🤔 What is up with MBtiles and OpenMapTiles (click to expand)
Good question.
MBtiles is the archive format. Think of a sqlite database storing the data you need a chunk (x/y/z) of the world.
See our comparison pmtiles vs. mbtiles for discussions on the pros and cons of this/alternative formats.
But how does the data in the archive look like?
This is where the vector tile schema comes in:
OpenMapTiles defines which layers are included in the served data and how they are aggregated.
OpenMapTiles does have an attribution requirement. You will need to have © OpenMapTiles at the bottom of your map.
See Shortbread for a newer, but less mature alternative if you want to read more.
Below command downloads a tile archive at data/monaco.mbtiles for monaco.
Please refer to Planetilers documentation on different download options.
mkdir --parents data
docker run \
  --user=$UID \
  -e JAVA_TOOL_OPTIONS="-Xmx1g" \
  -v "$(pwd)/data":/data \
  --rm \
  ghcr.io/onthegomap/planetiler:latest \
  --download \
  --minzoom=0 \
  --maxzoom=14 \
  --tile_compression=none \
  --area=monaco \
  --output /data/monaco.mbtiles
Loading data into a PostGIS database
Run PostGIS
First, you need a running postGIS instance.
docker run \
  --name some-postgis \
  --env POSTGRES_PASSWORD=mypass \
  --publish 5432:5432 \
  --detach \
  postgis/postgis
Import Points into PostGIS
Then you need to add geometries to the PostGIS database.
This is possible via multiple ways, such as osm2pgsql for adding specific, updatable OSM data or in the programming language of your choice via postgres’ various database connectors.
docker exec some-postgis psql --dbname postgres --username postgres --command \
  "CREATE TABLE where_yachts_can_be_looked_at ("\
  "  title TEXT NOT NULL, "\
  "  subtitle TEXT NOT NULL, "\
  "  location GEOMETRY(Point, 4326) NOT NULL);"

docker exec some-postgis psql --dbname postgres --username postgres --command \
  "INSERT INTO where_yachts_can_be_looked_at (title, subtitle, location) VALUES ( "\
  "  'Port Hercules', "\
  "  'Great view of superyachts docked in the iconic harbor.', "\
  "  ST_SetSRID(ST_MakePoint(7.424789, 43.735217), 4326));"
Serving tiles with Martin
Now we will serve the content of mbtiles and the postgis database.
If you want more precise options what things are published how, please see the configuration file or cli documentation. By default, we will share every servable postgres table, view and function.
martin data/monaco.mbtiles postgres://postgres:mypass@localhost:5432/postgres
You can now see the catalog of available things here: http://localhost:3000/catalog
The tilejson endpoint of both tilesets is http://localhost:3000/monaco,where_yachts_can_be_looked_at
Using in Maputnik to style a map
Due to CORS, we CANNOT use the website https://maplibre.org/maputnik/ without further setup. Once the tiles are deployed behind https, this can be used.
To get a local version of maputnik, run
docker run -it --rm -p 8888:80 ghcr.io/maplibre/maputnik:main
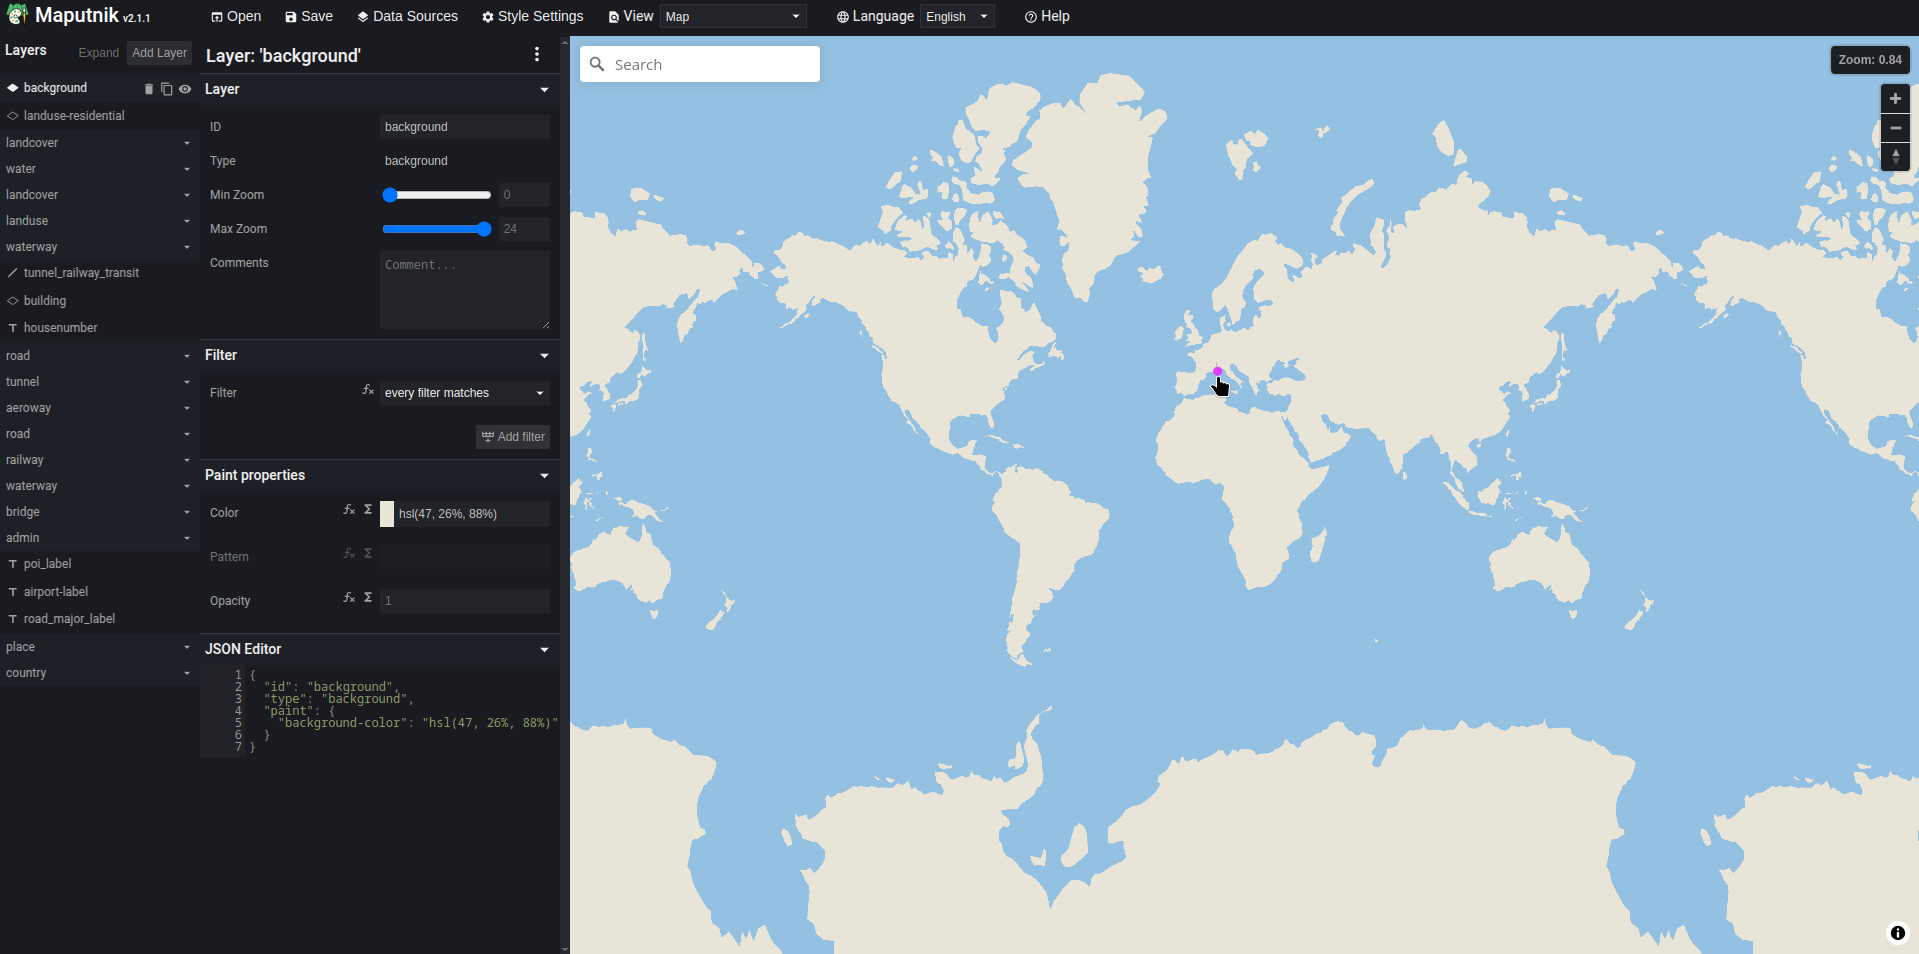
Maputnik is now online, so lets load martins tiles into it.
- Visit
http://localhost:8888 - You first need a style:
- Click
Open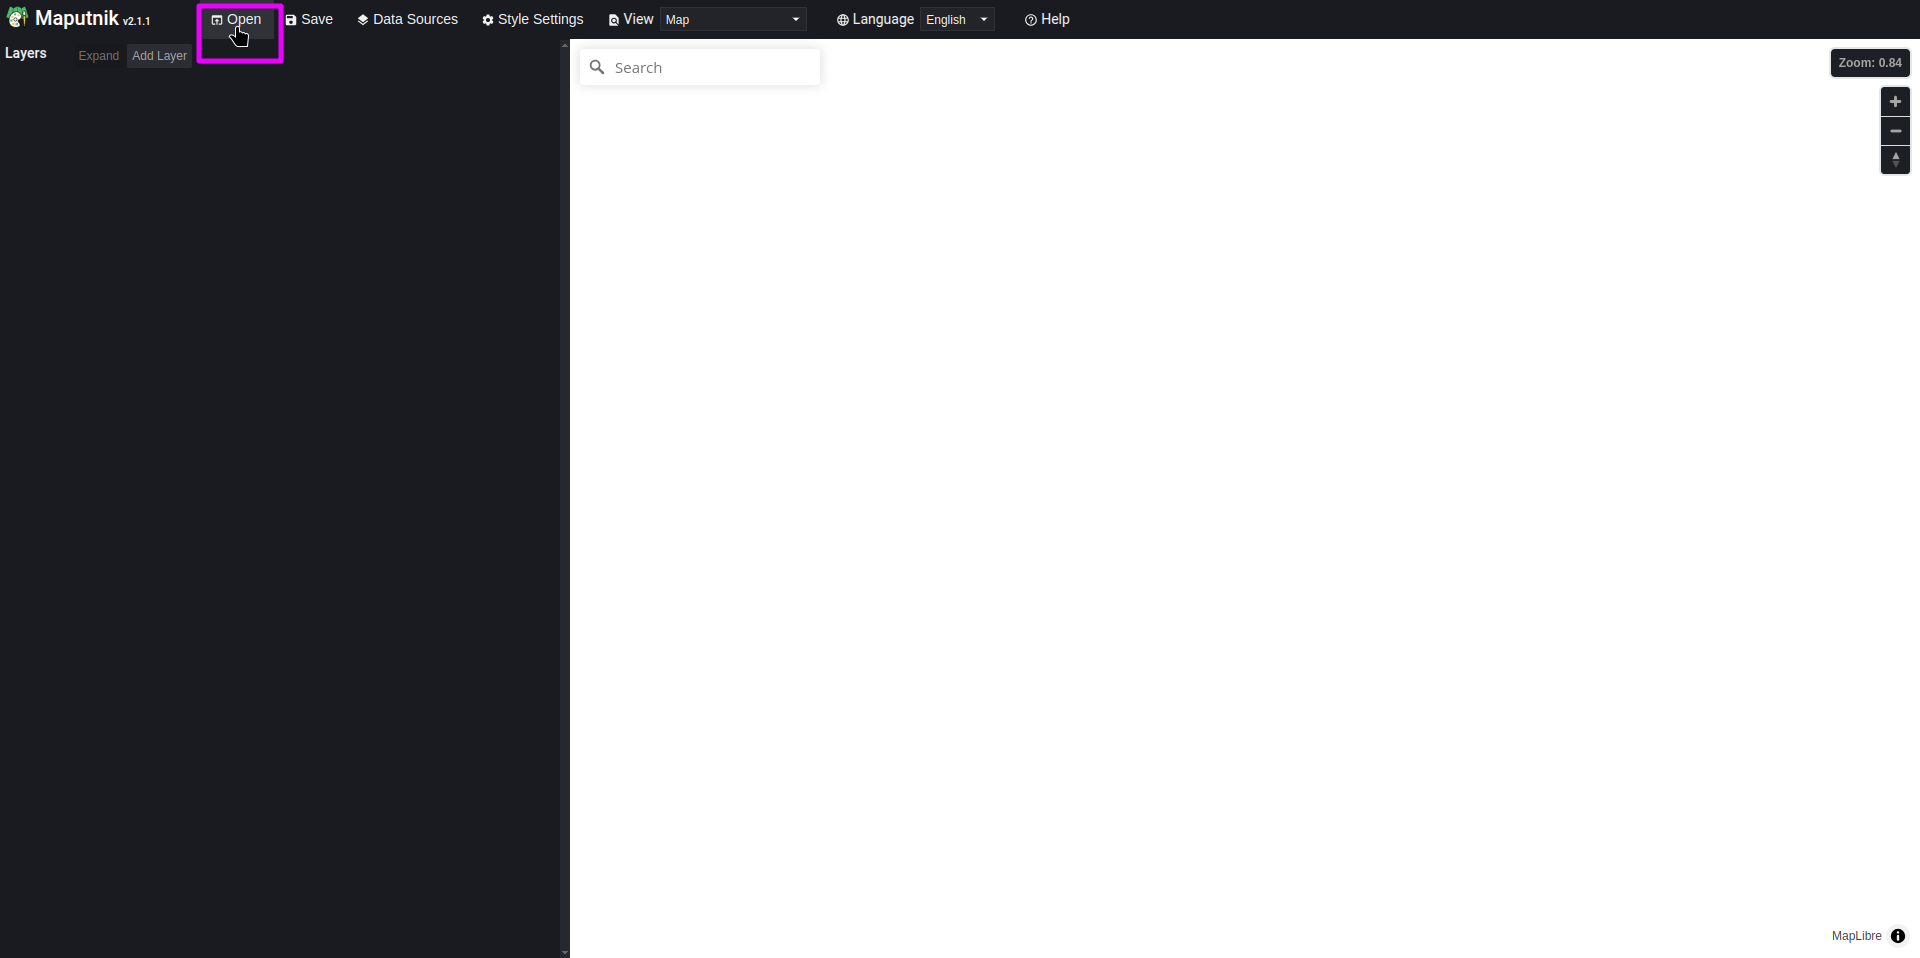
- Select a style you like (we are going to choose
Maptiler Basic)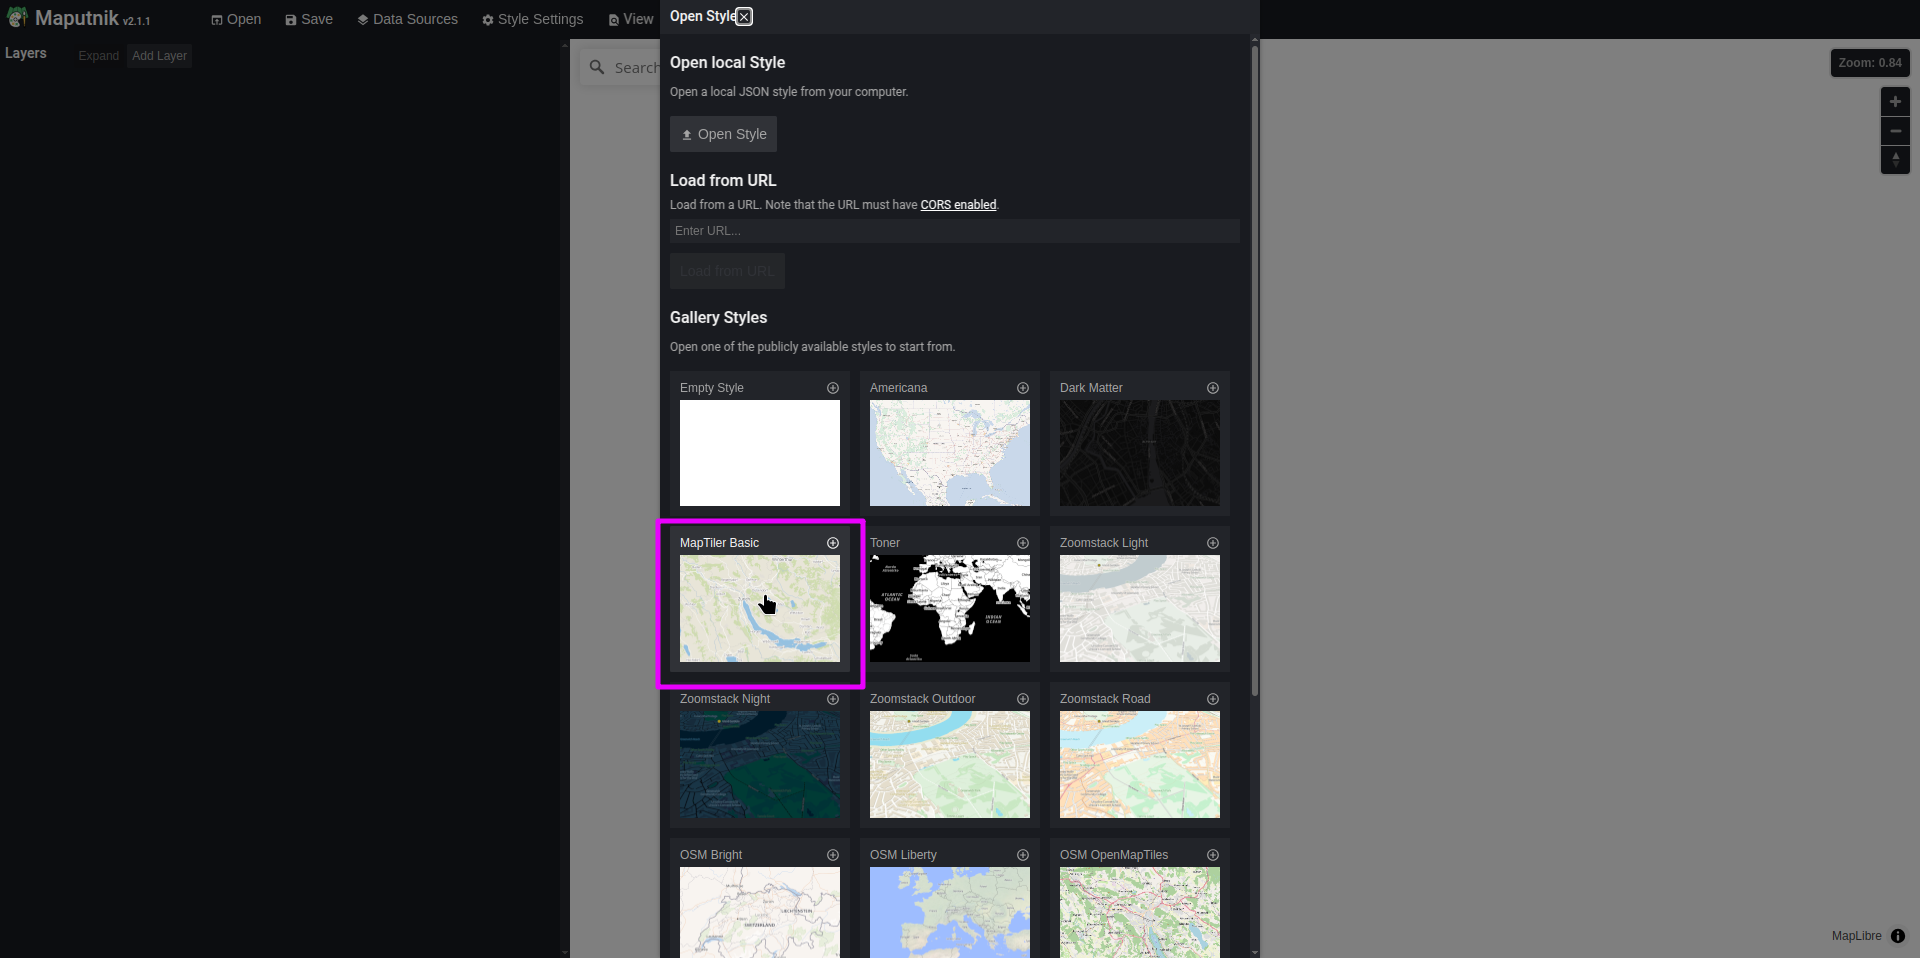
- Click
- You now have a style using Maptilers’ (NOT martins) data. You need to change its datasource to use the tiles we just published:
- Click
Data Sources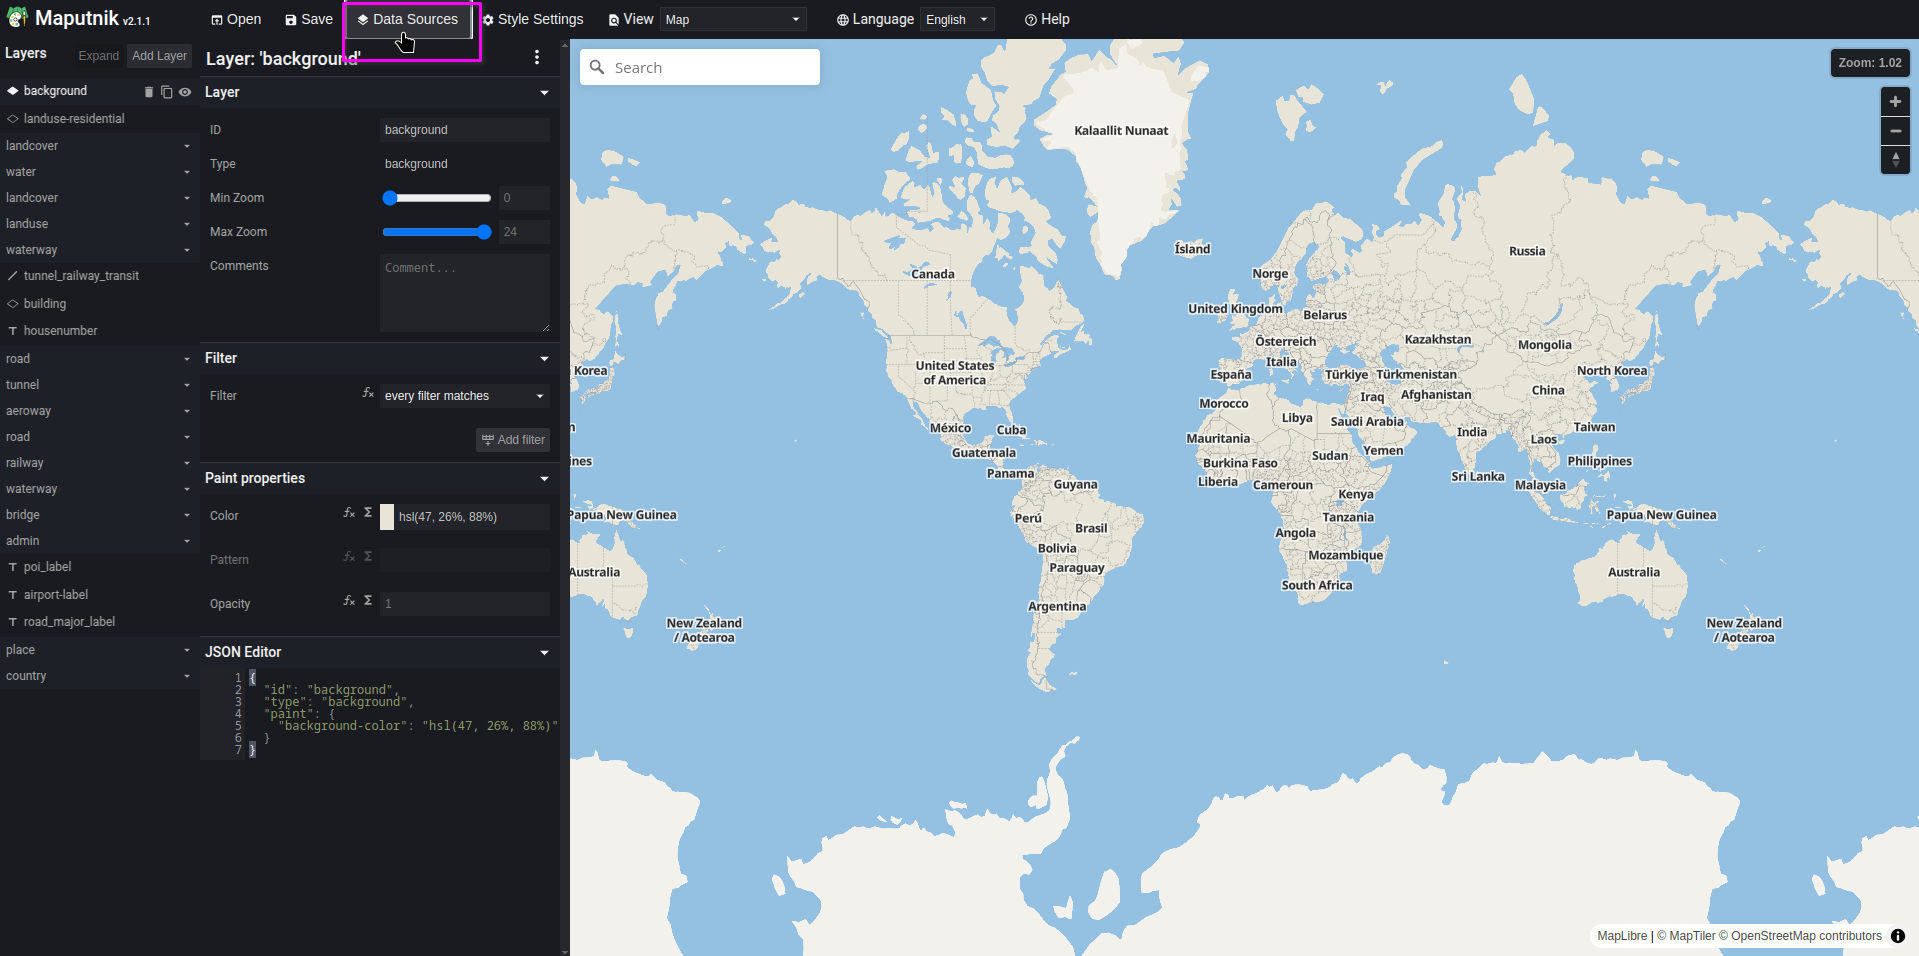
- And add the tilejson from above
http://localhost:3000/monaco,where_yachts_can_be_looked_at: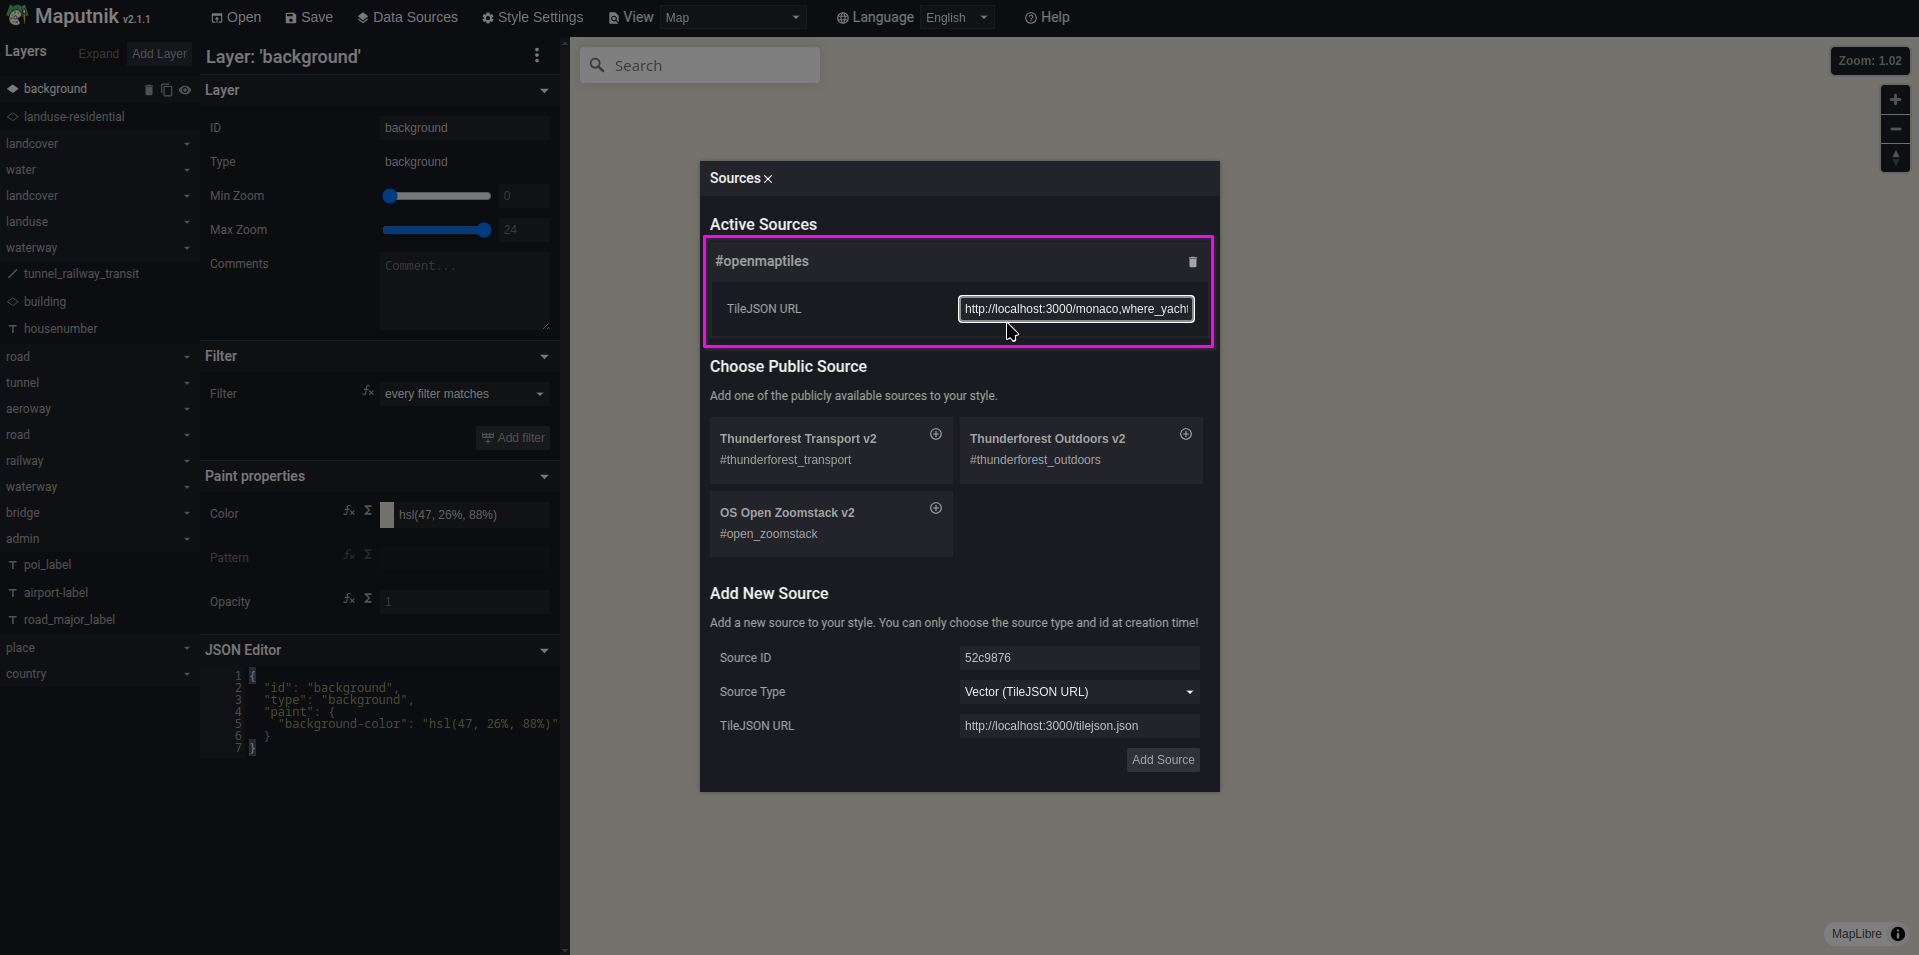
- Click
- Now, lets zoom into monaco:
- And finally, lets add a circle layer for our yachts:
-
Click
Add Layer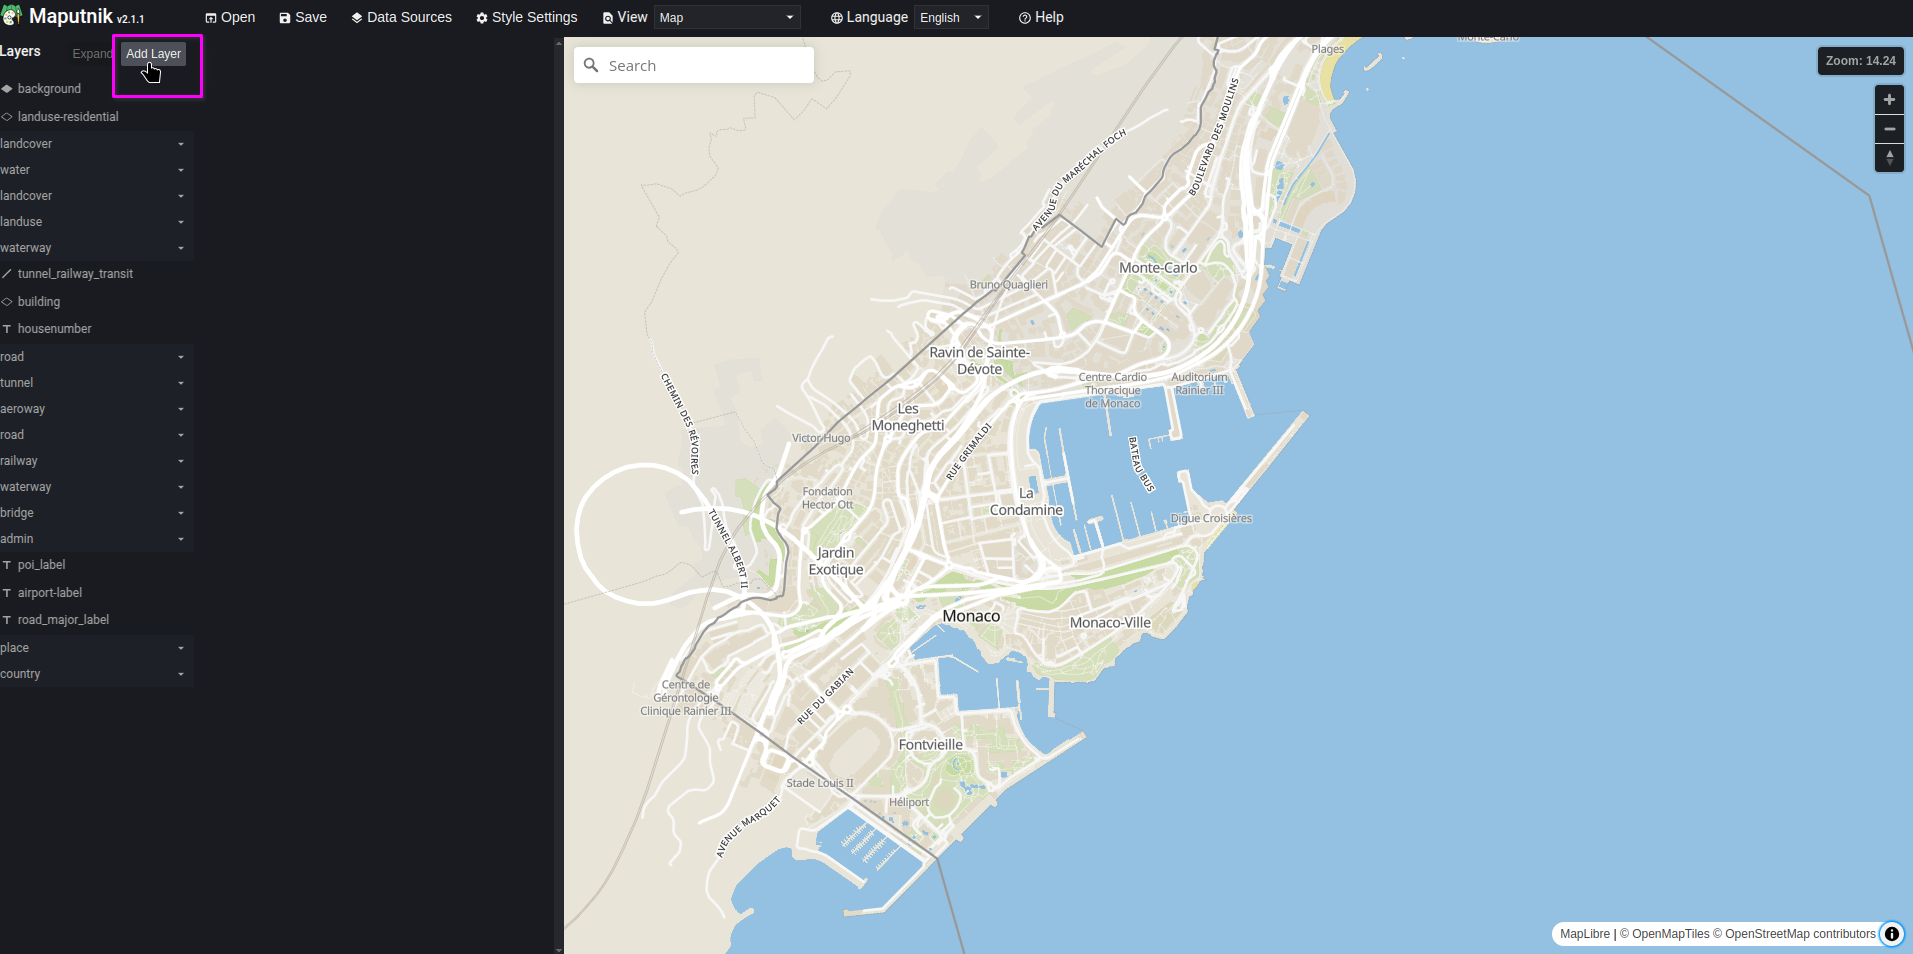
-
Configure the layer as follows:
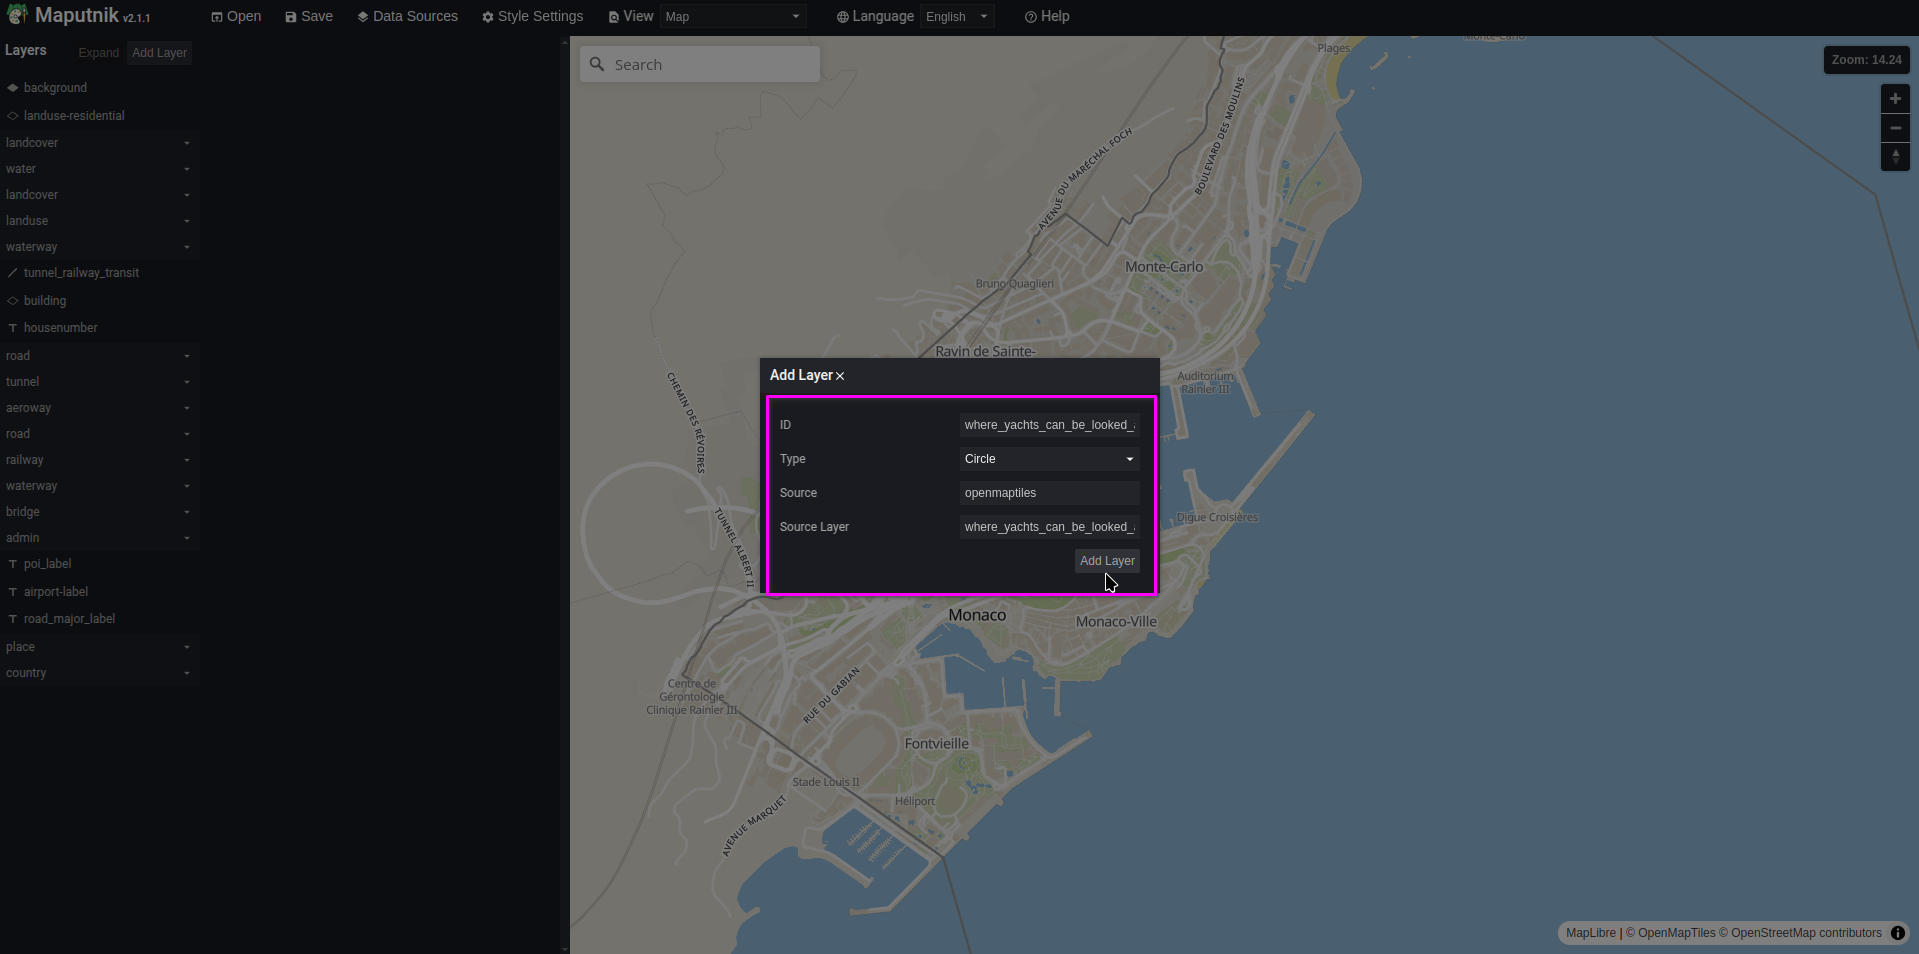
-
And style it as:
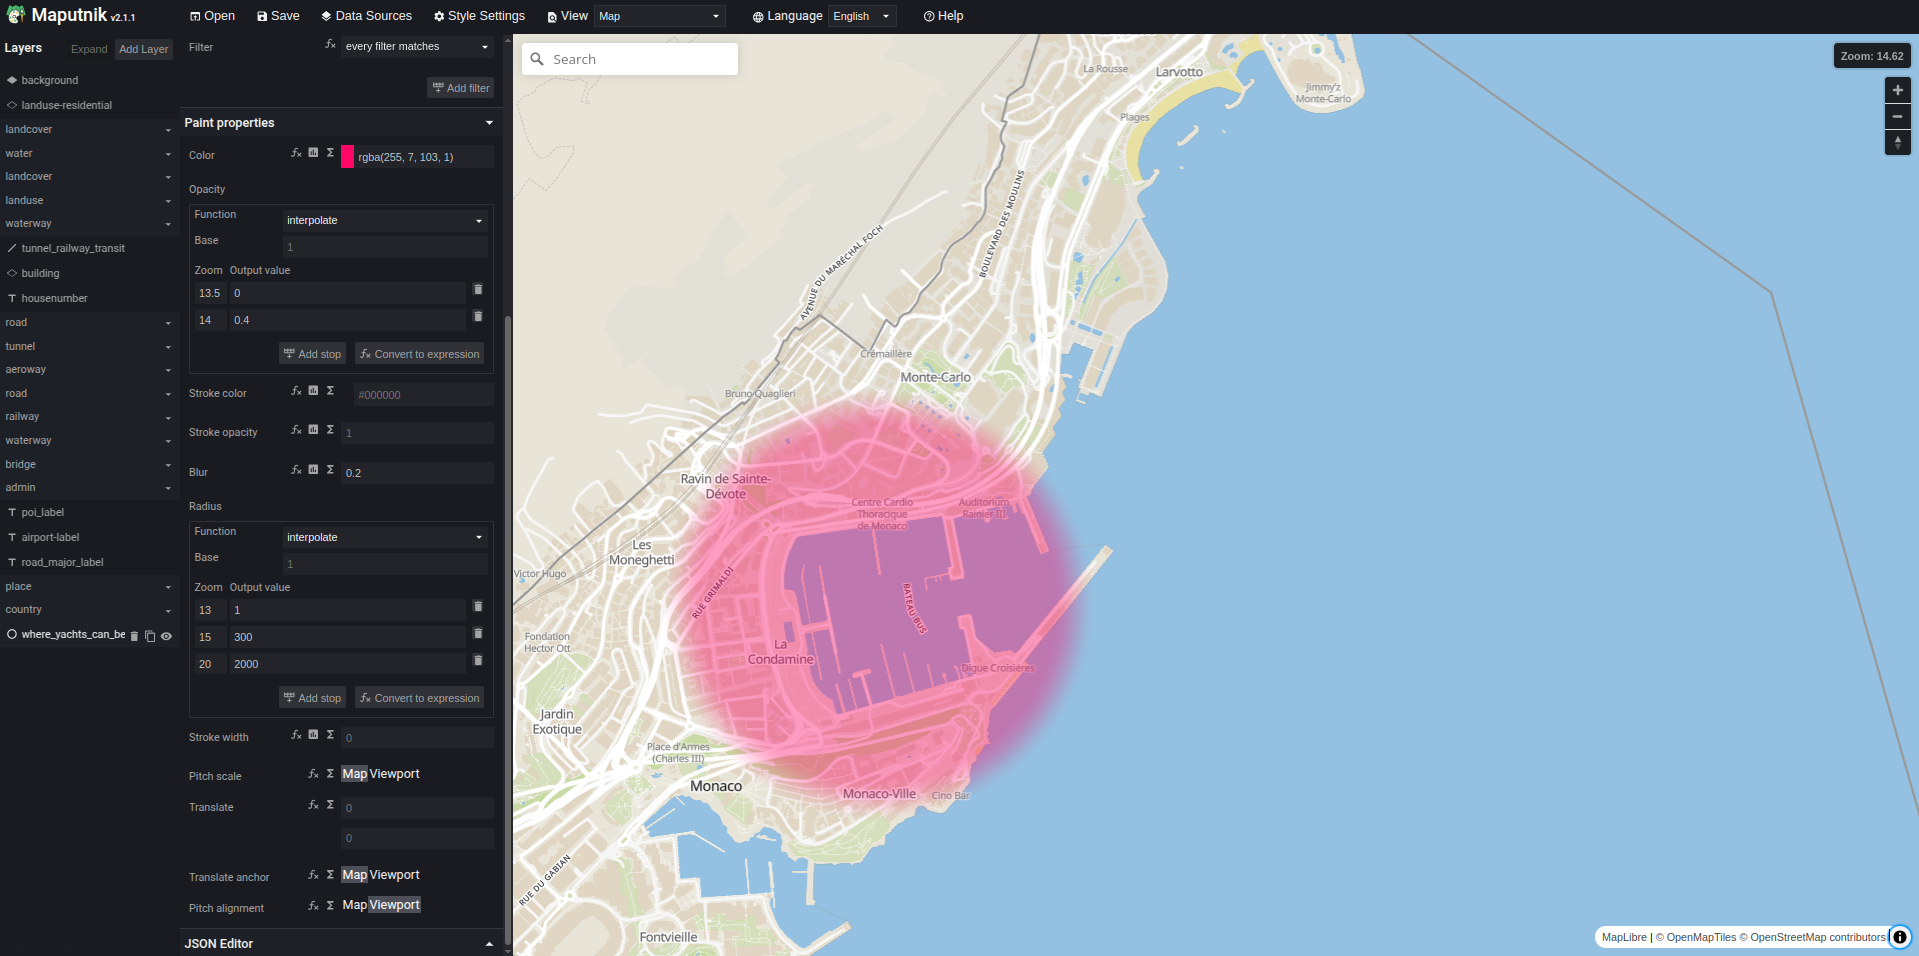
json configuration (click to expand)
{
  "id": "where_yachts_can_be_looked_at",
  "type": "circle",
  "source": "openmaptiles",
  "source-layer": "where_yachts_can_be_looked_at",
  "paint": {
    "circle-color": "rgba(255, 7, 103, 1)",
    "circle-blur": 0.2,
    "circle-radius": {
      "stops": [
        [13, 1],
        [15, 300],
        [20, 2000]
      ]
    },
    "circle-opacity": {
      "stops": [[13.5, 0], [14, 0.4]]
    }
  },
  "minzoom": 13
}
-