Overview
Map Basics
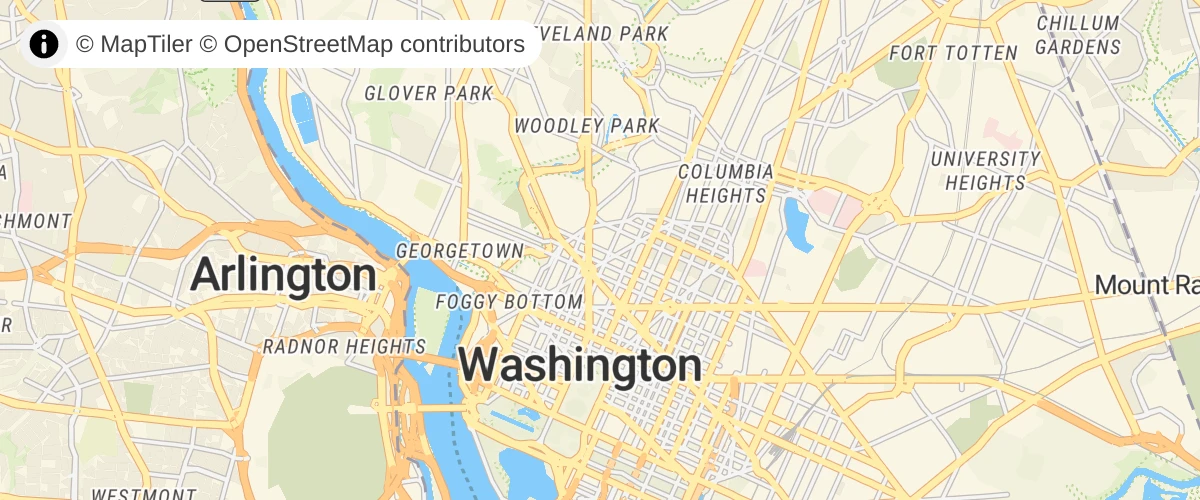
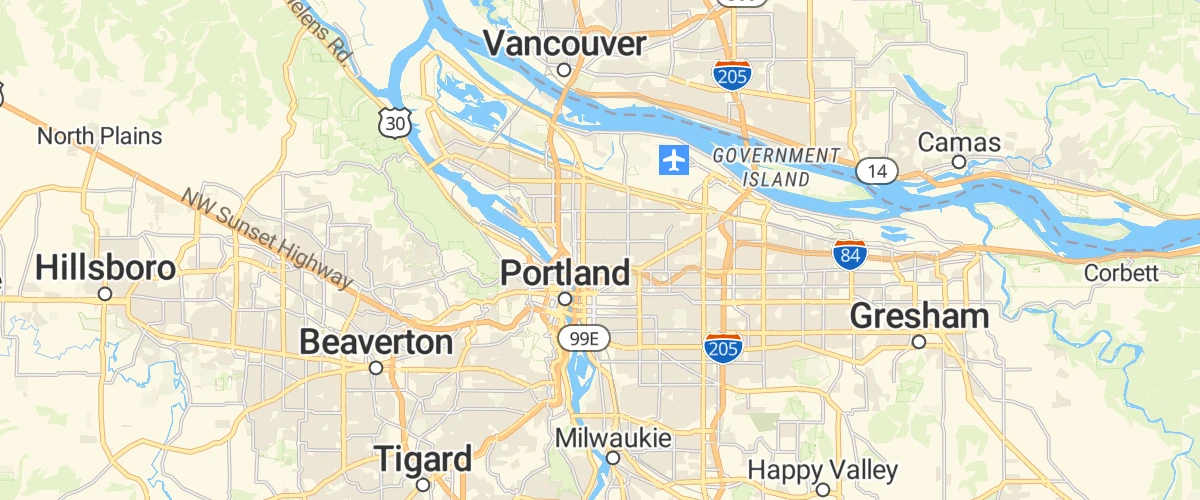
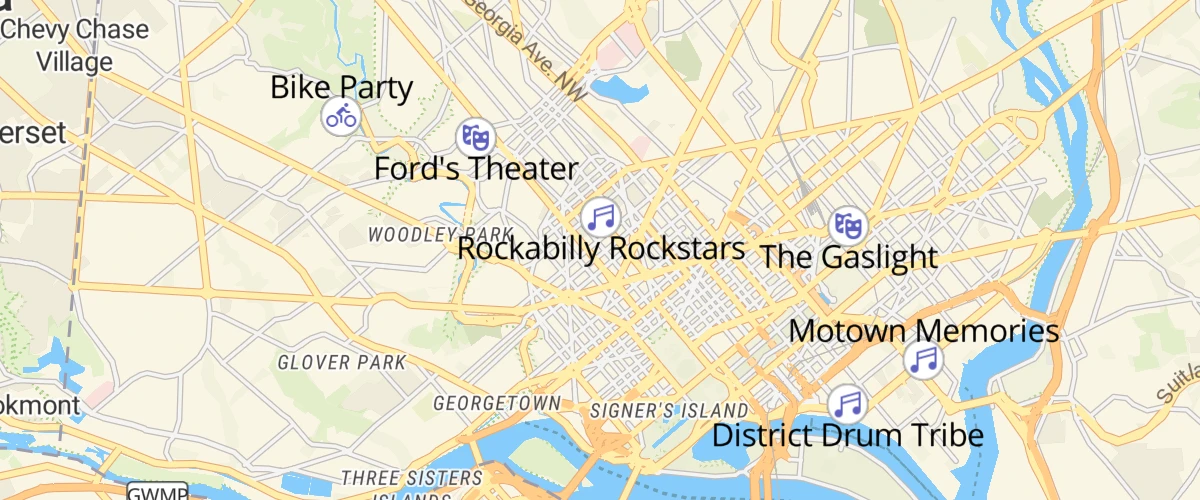
Display a map
Initialize a map in an HTML element with MapLibre GL JS.
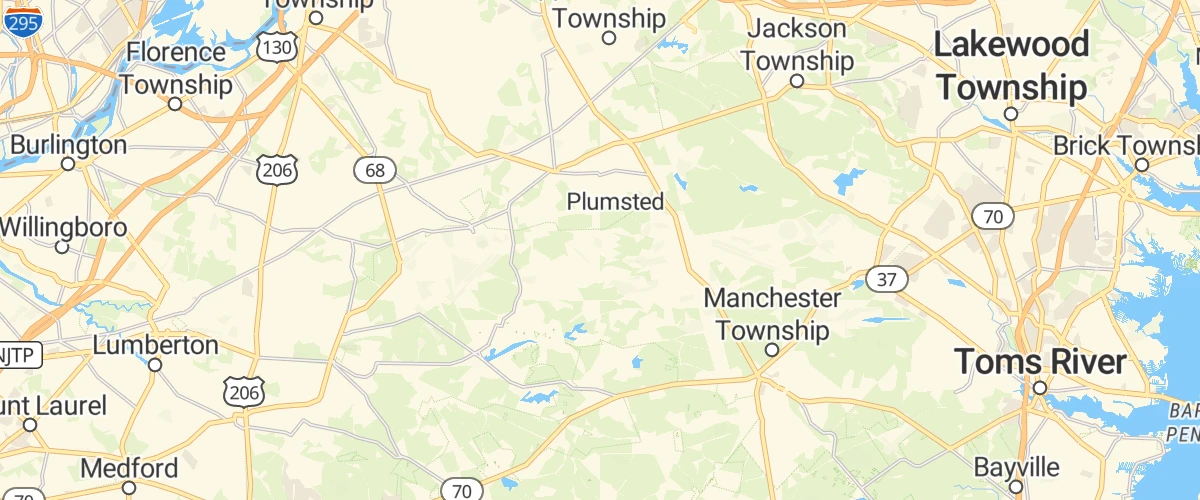
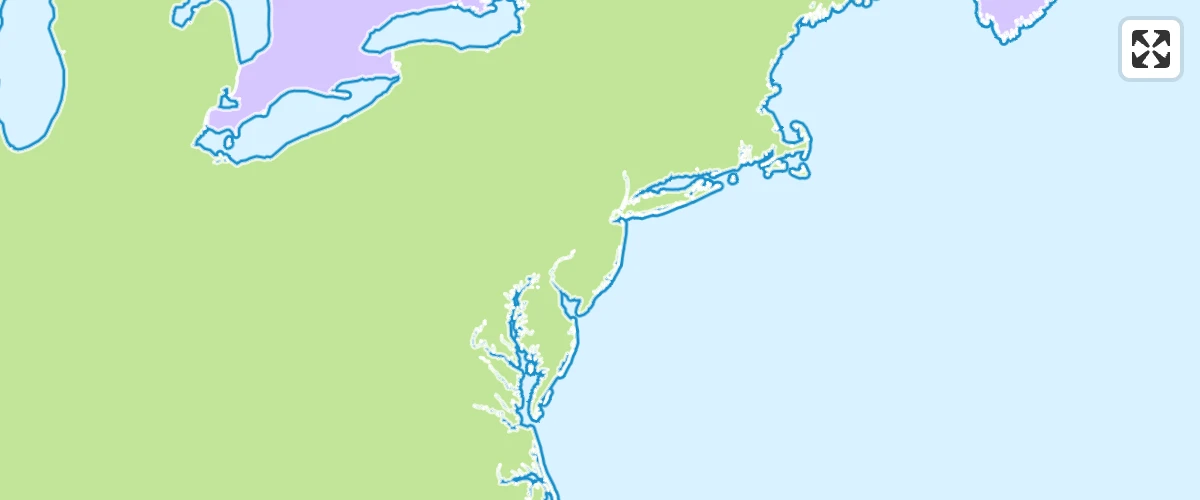
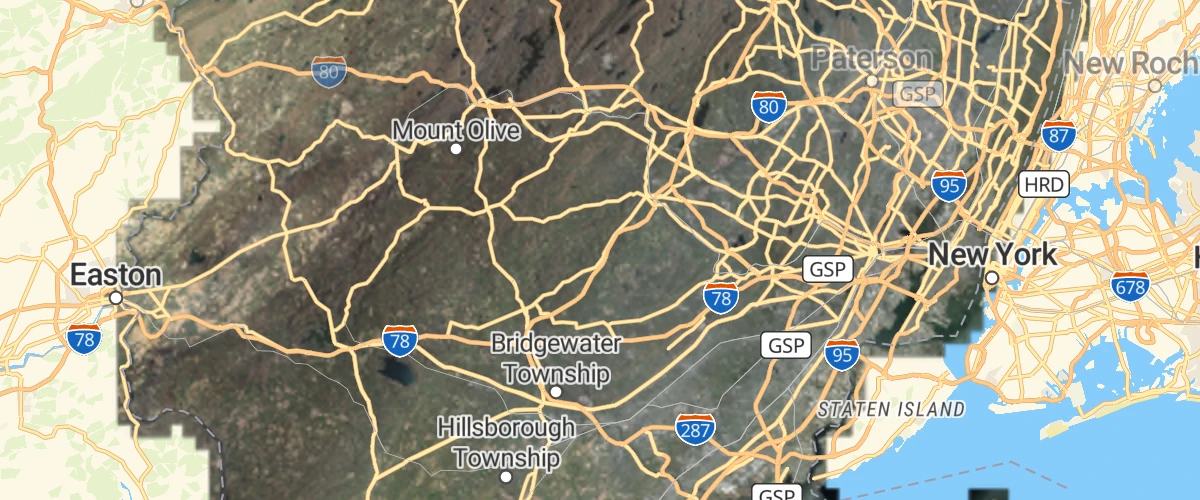
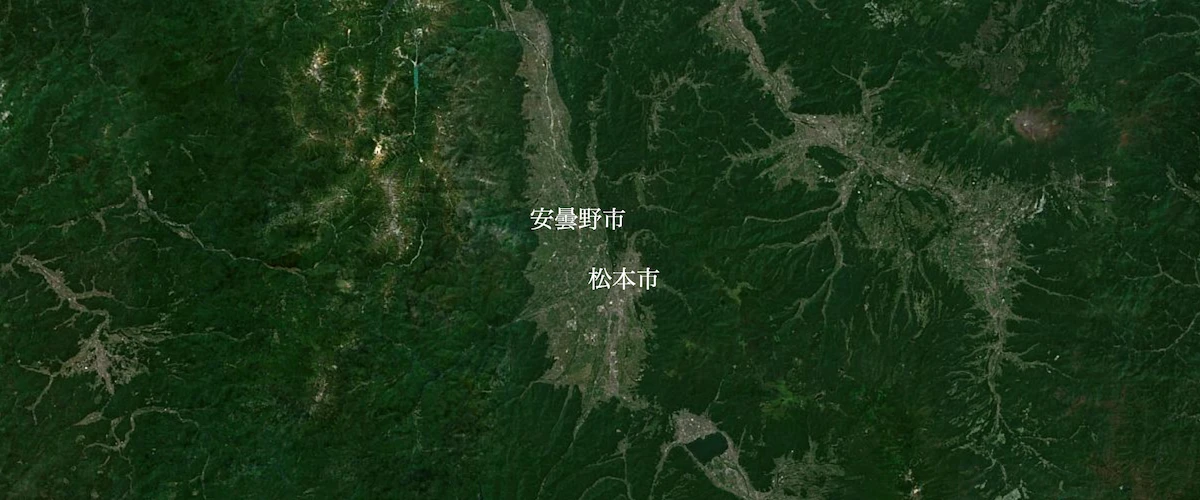
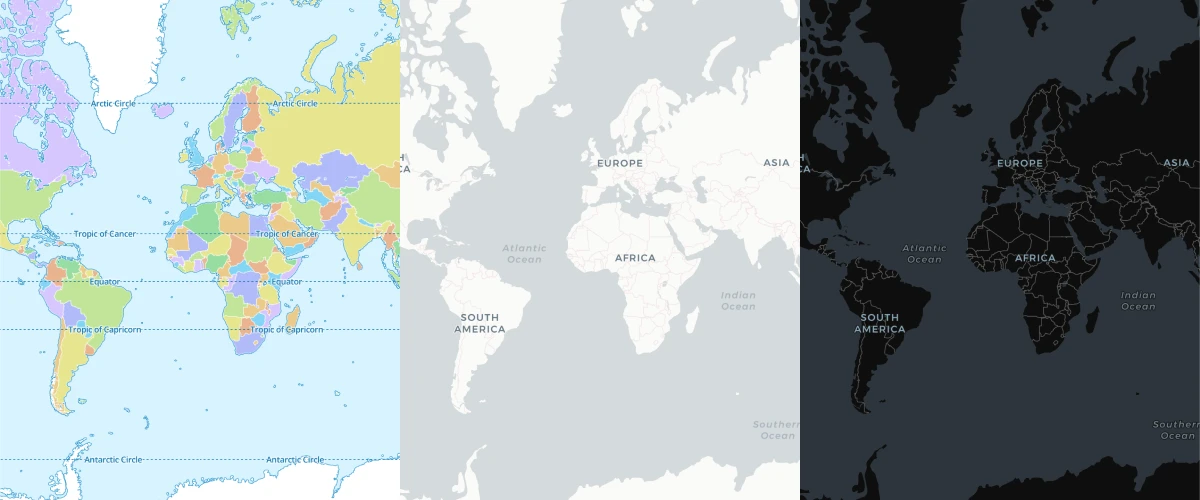
Display a satellite map
Display a satellite raster baselayer.
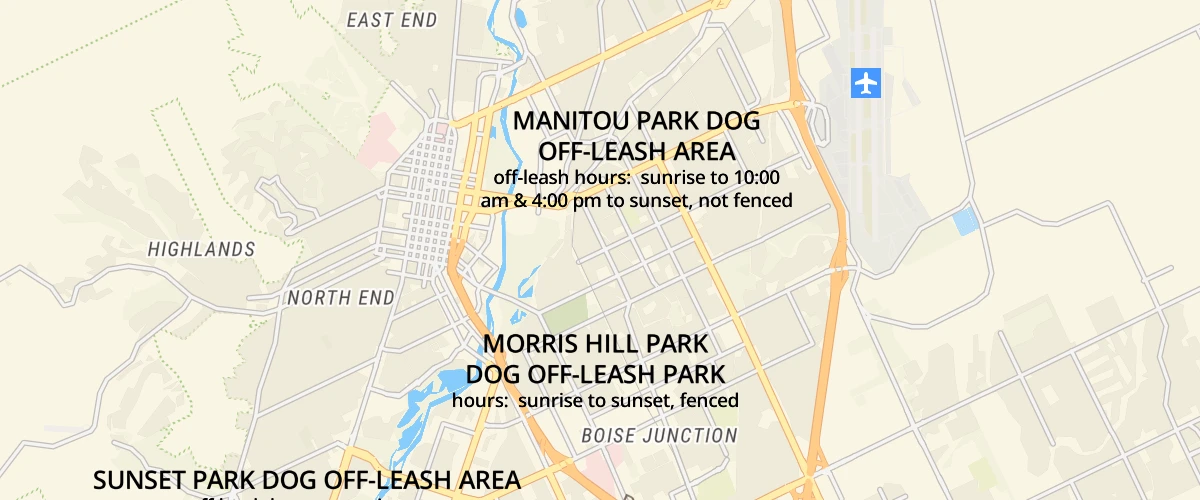
Display a non-interactive map
Disable interactivity to create a static map.
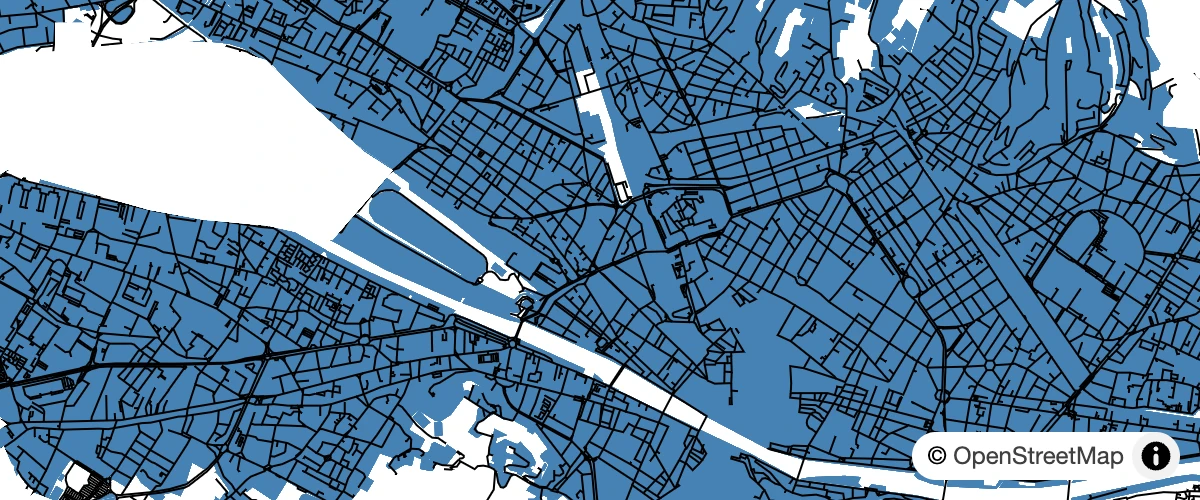
Change the default position for attribution
Place attribution in the top-left position when initializing a map.
Check if WebGL is supported
Check for WebGL browser support.
Display a map with MLT
Initialize a map in an HTML element with MapLibre GL JS. This example is using a style that uses MLT (MapLibre Tiles). The example is very similar to the regular one except the tiles are in a different encoding.

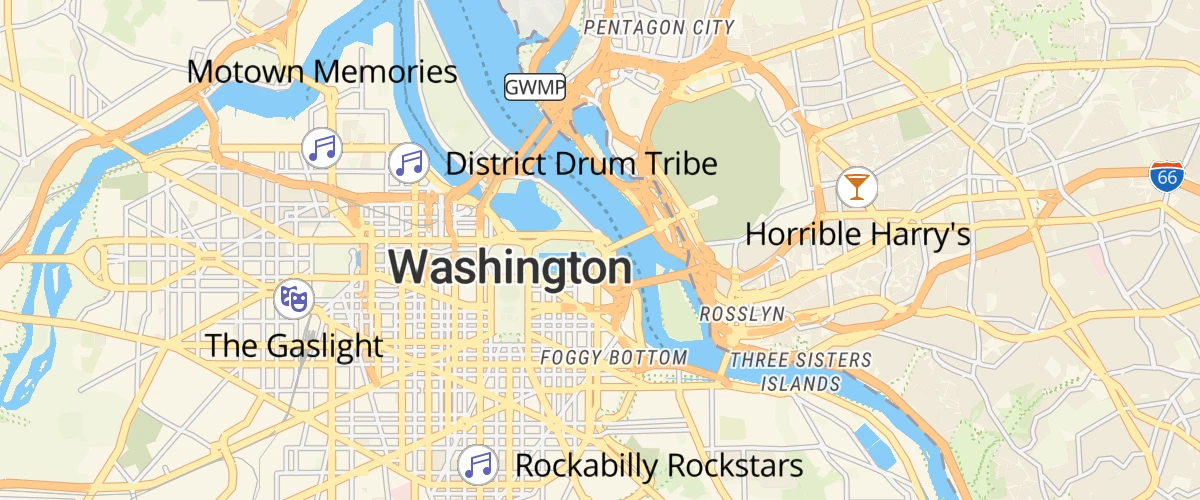
Fly to a location
Use flyTo to smoothly interpolate between locations.
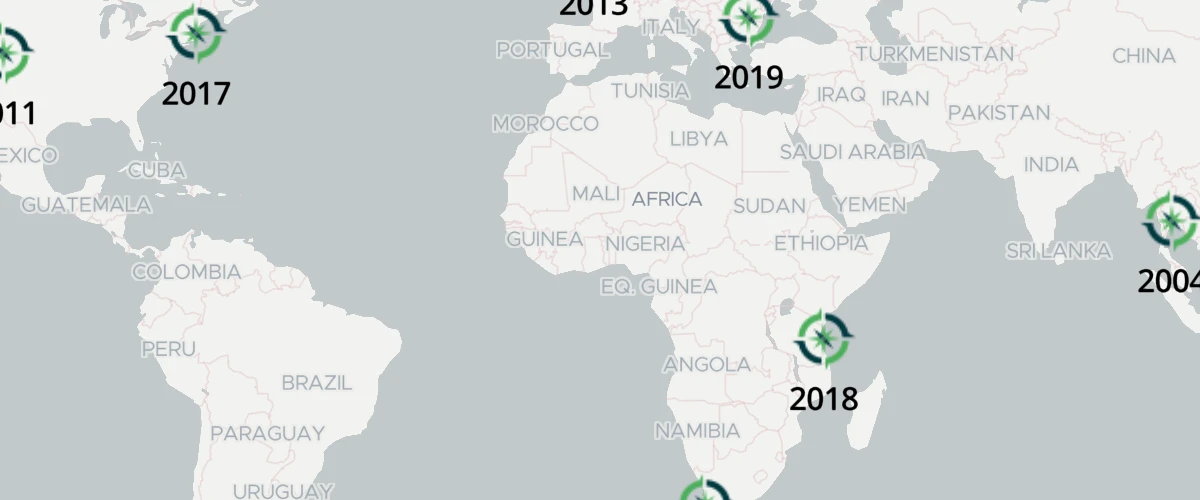
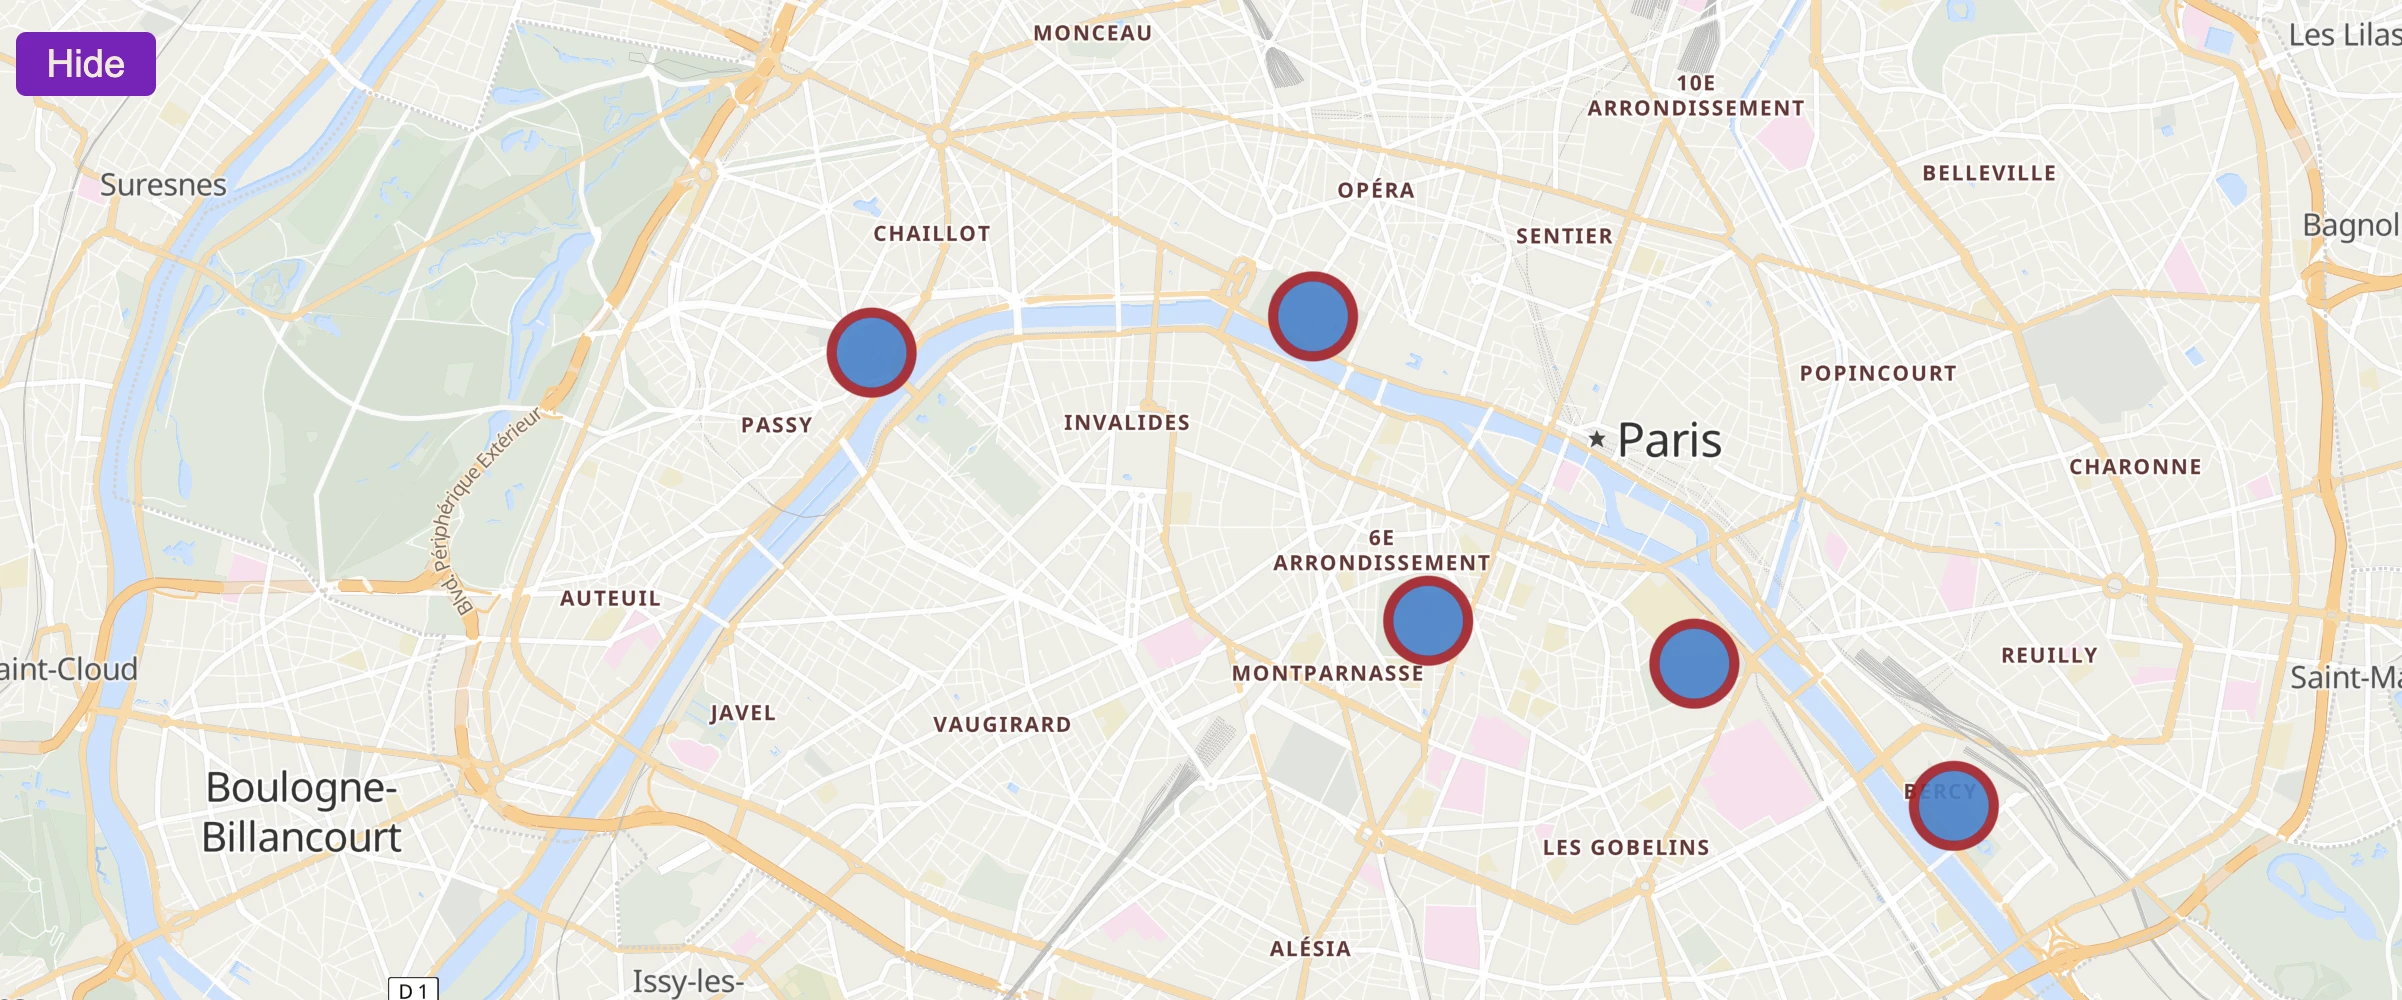
Jump to a series of locations
Use the jumpTo function to showcase multiple locations.
Set pitch and bearing
Initialize a map with pitch and bearing camera options.
Slowly fly to a location
Use flyTo with flyOptions to slowly zoom to a location.
Animate a line
Animate a line by updating a GeoJSON source on each frame.
Animate a point
Animate the position of a point by updating a GeoJSON source on each frame.
Animate a point along a route
Use Turf to smoothly animate a point along the distance of a line.
Animate map camera around a point
Animate the map camera around a point.
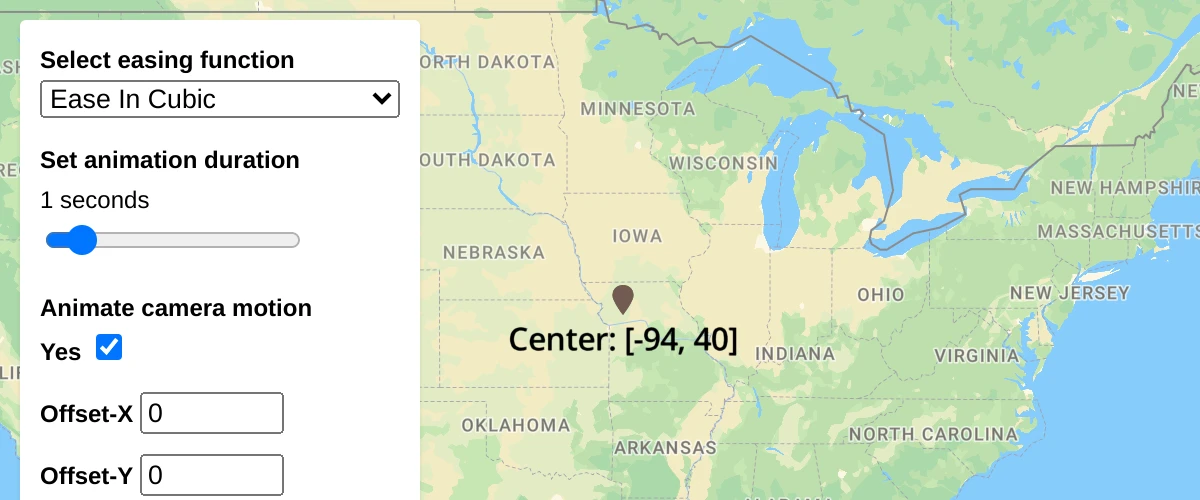
Customize camera animations
Customize camera animations using AnimationOptions.
Customize the map transform constrain
Customize the constrain callback of the map transform. For example, to allow users to underzoom and overpan the bounds.
 new
new
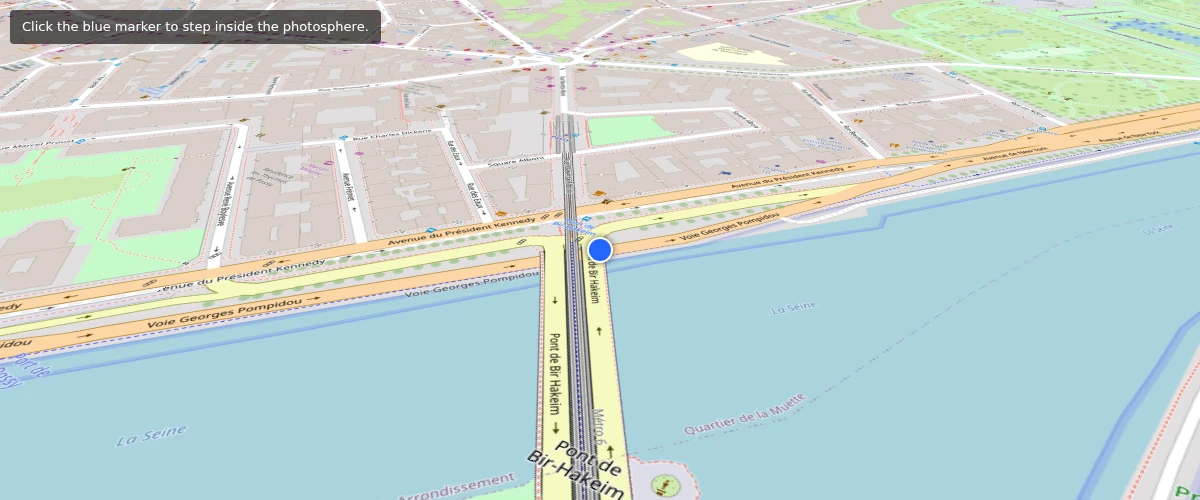
Enter a 360° photosphere
Click a marker to smoothly enter an immersive 360° photosphere at a fixed point, blended with the live map; exit to return to normal navigation.
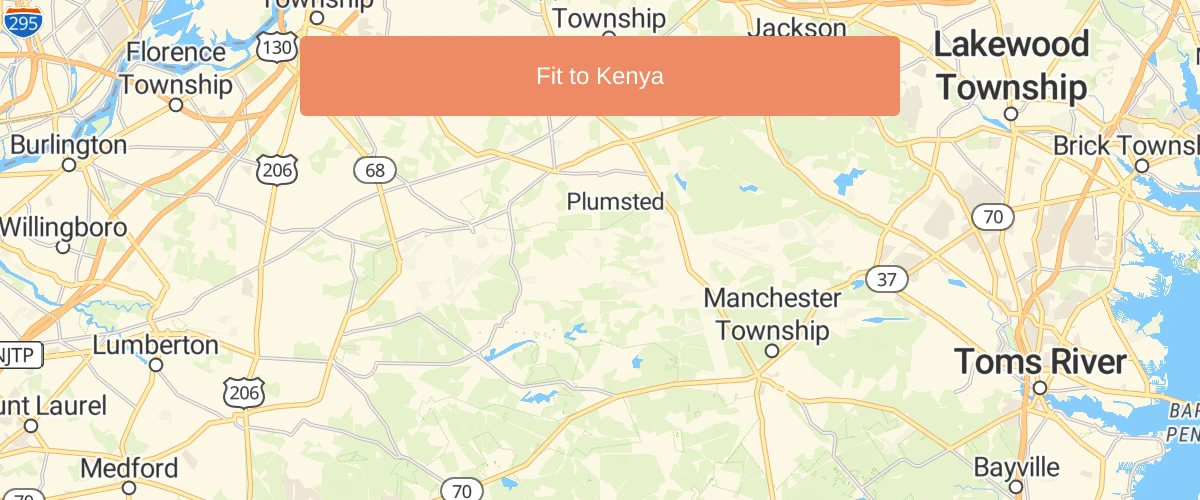
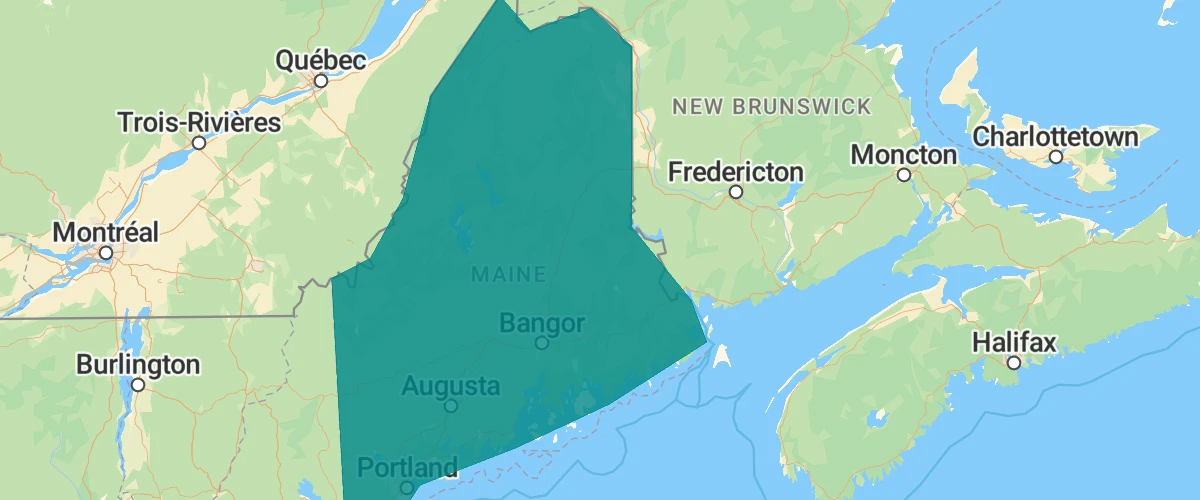
Fit a map to a bounding box
Fit the map to a specific area, regardless of the pixel size of the map.
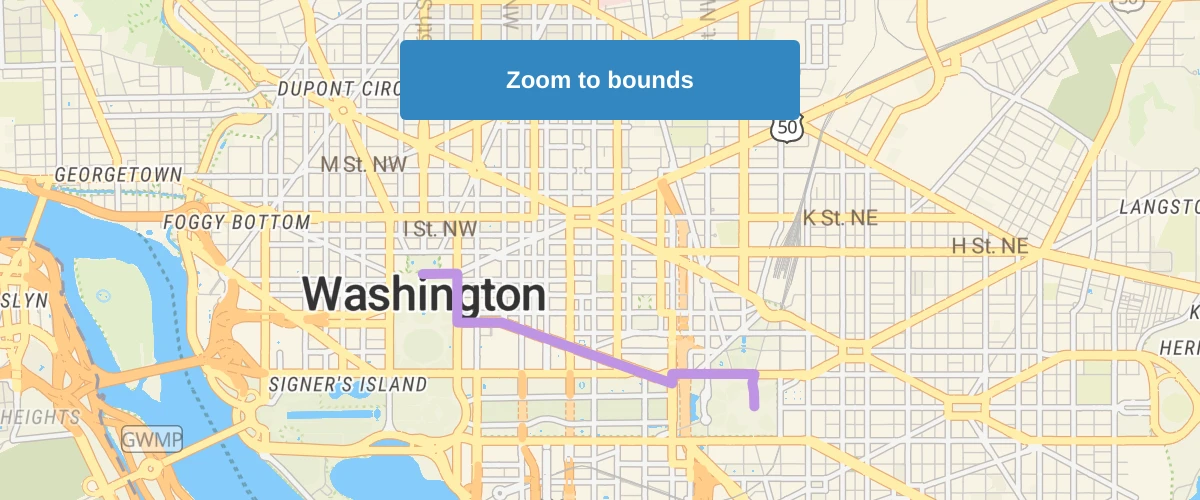
Fit to the bounds of a LineString
Get the bounds of a LineString.
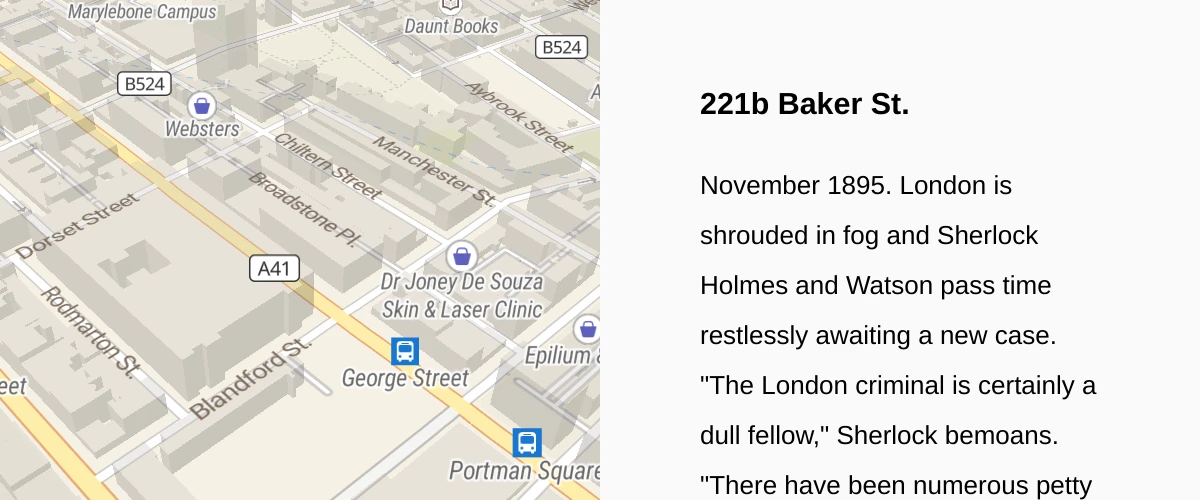
Fly to a location based on scroll position
Scroll down through the story and the map will fly to the chapter's location.
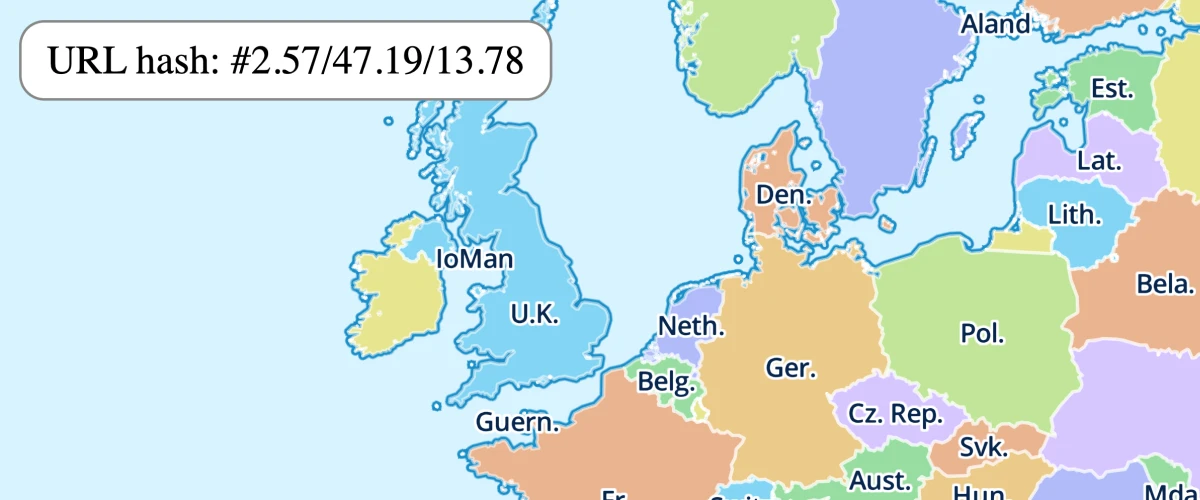
Hash routing
Keep the viewport state in the url with hash routing.
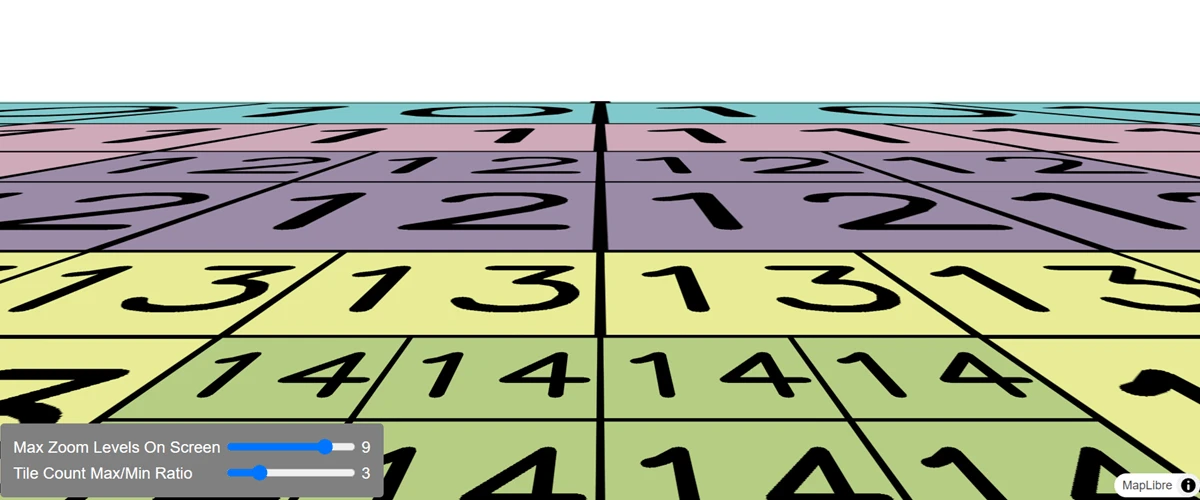
Level of Detail Control
Modify how Level of Detail behaves at high pitch angles.
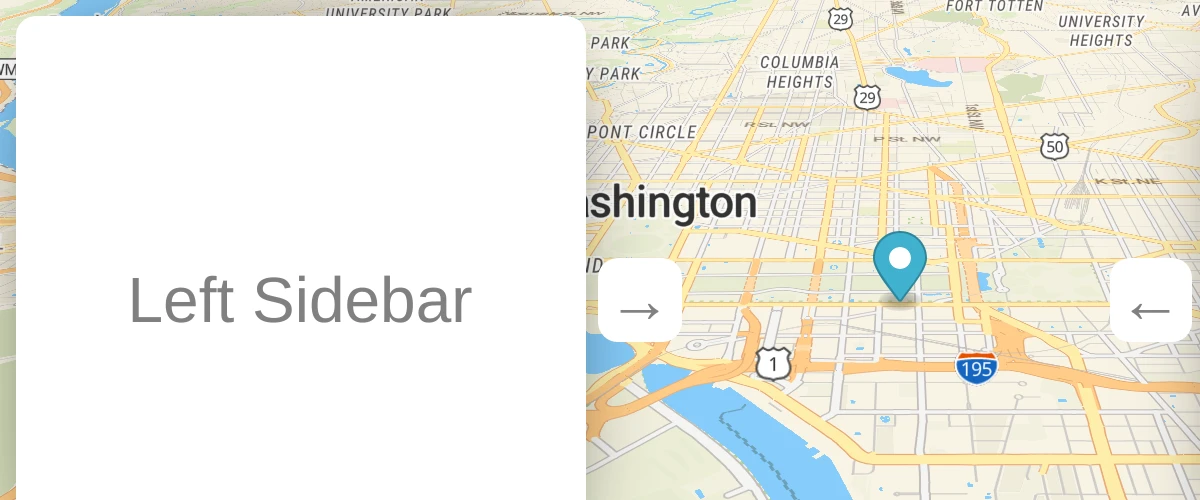
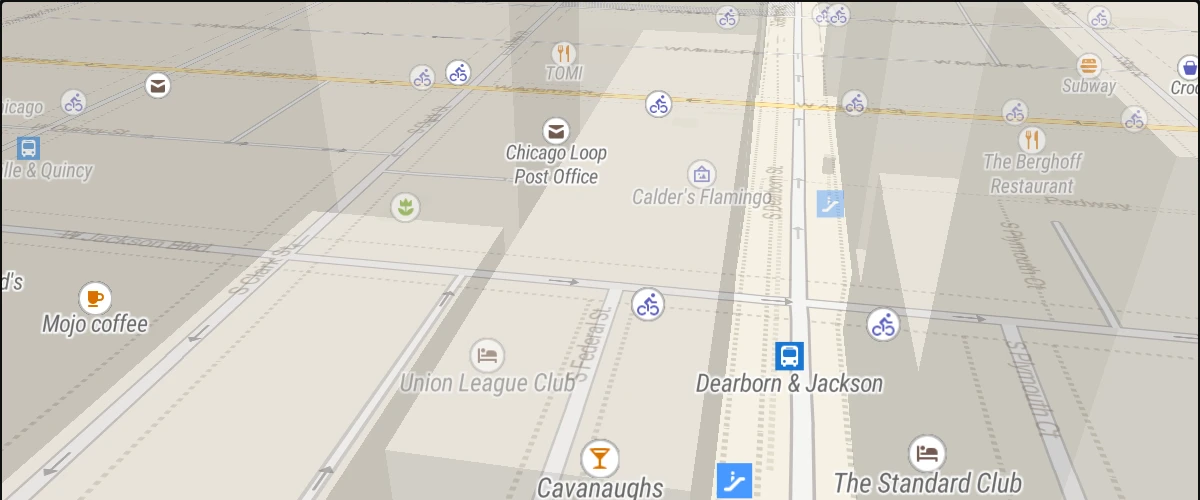
Offset the vanishing point using padding
Offset the center or vanishing point of the map to reduce distortion when floating elements are displayed over the map.
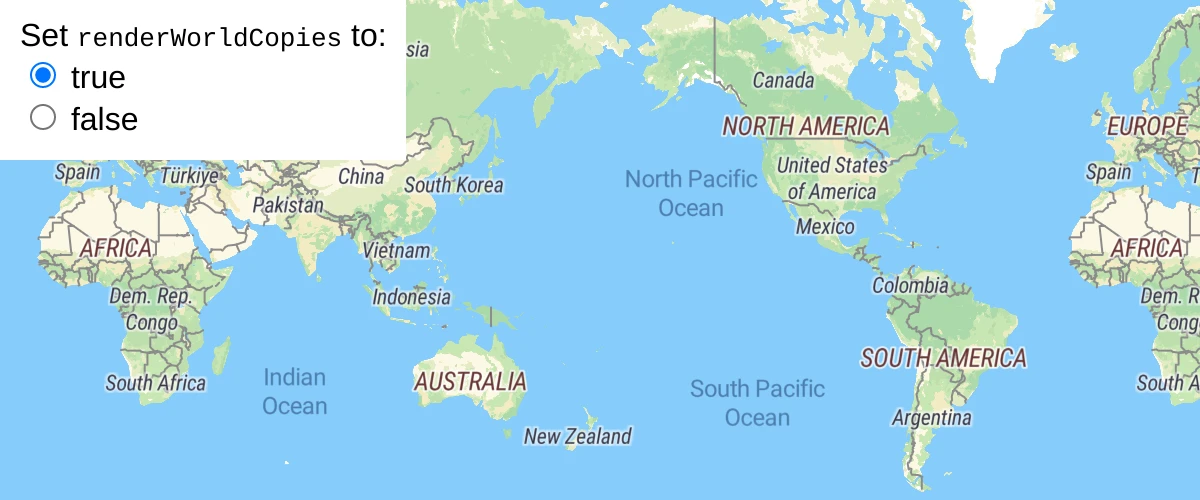
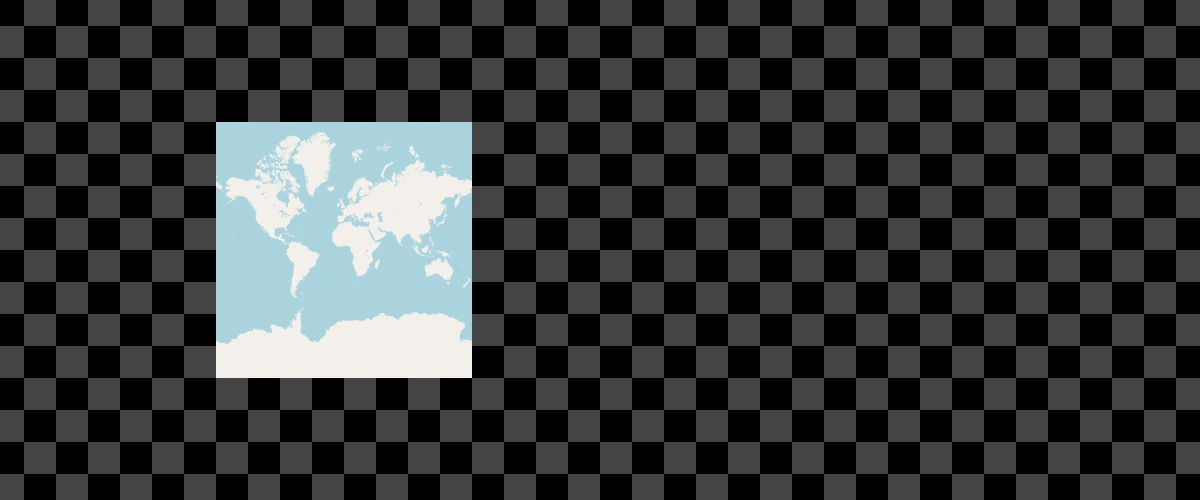
Render world copies
Toggle between rendering a single world and multiple copies of the world using setRenderWorldCopies.
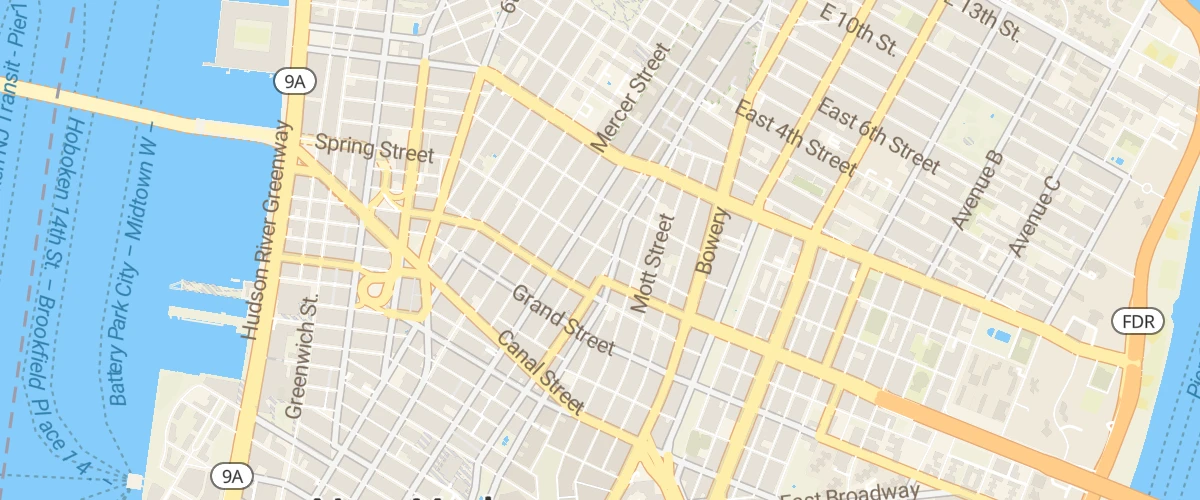
Restrict map panning to an area
Prevent a map from being panned to a different place by setting maxBounds.
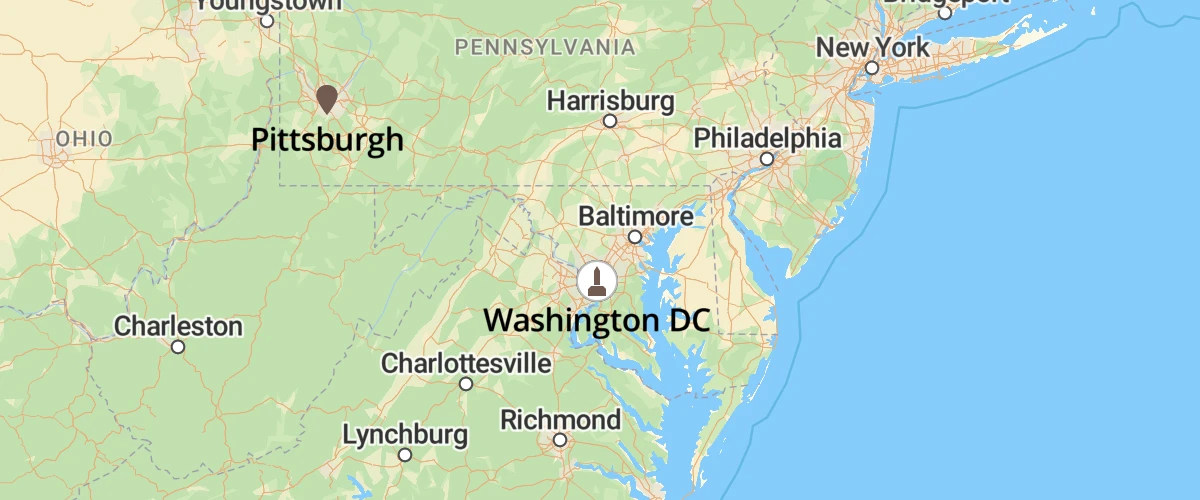
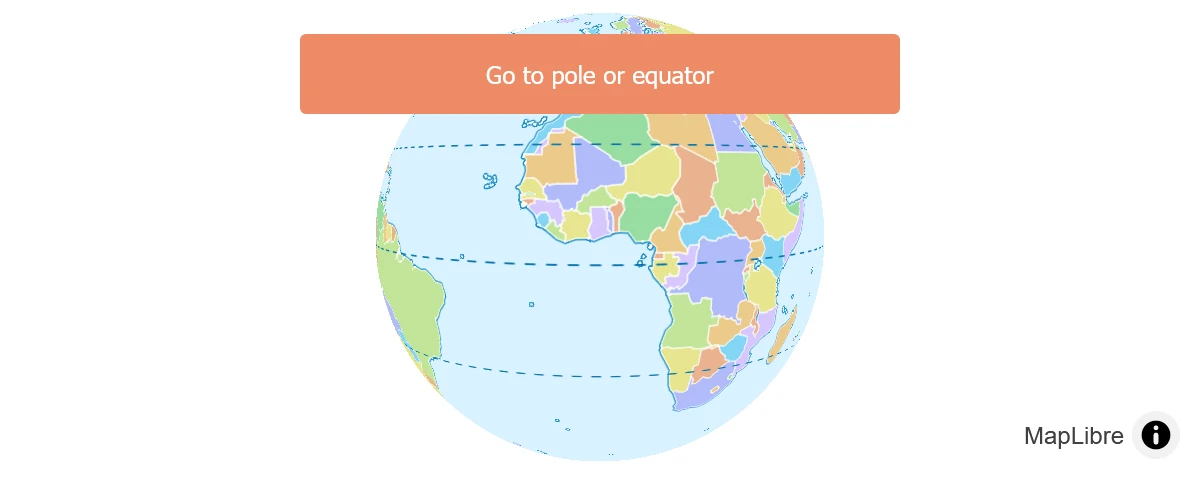
Set center point above ground
Set the center point above ground level.
 new
new
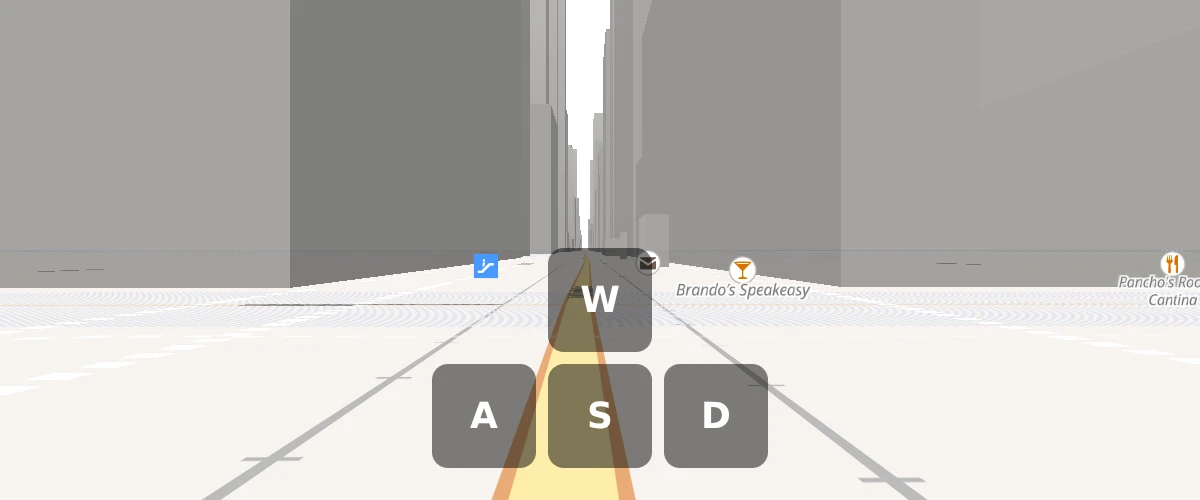
Walk around a map in first person
Drive an eye-height, level first-person camera over 3D buildings with the keyboard or on-screen buttons
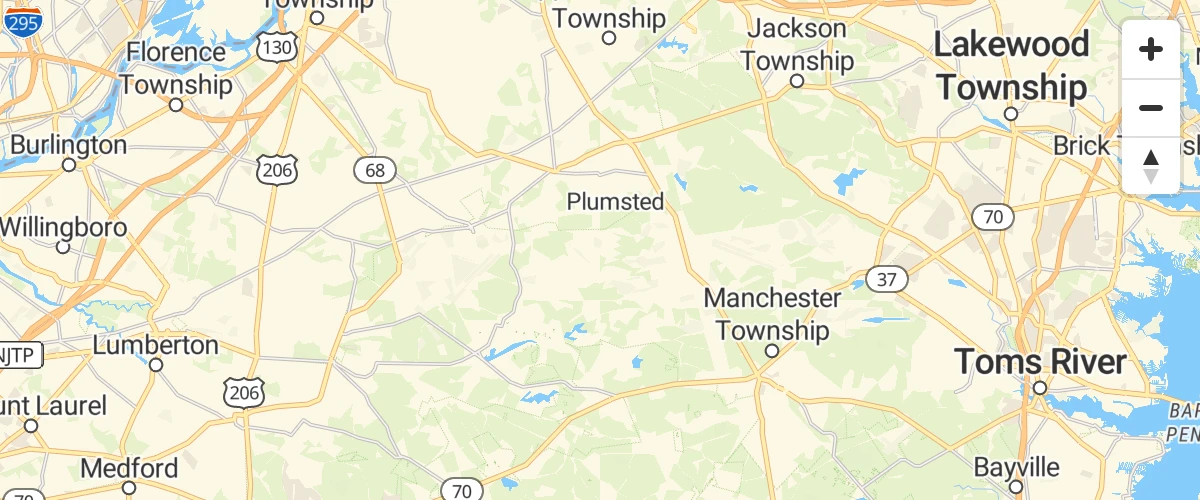
Display map navigation controls
Add zoom and rotation controls to the map.
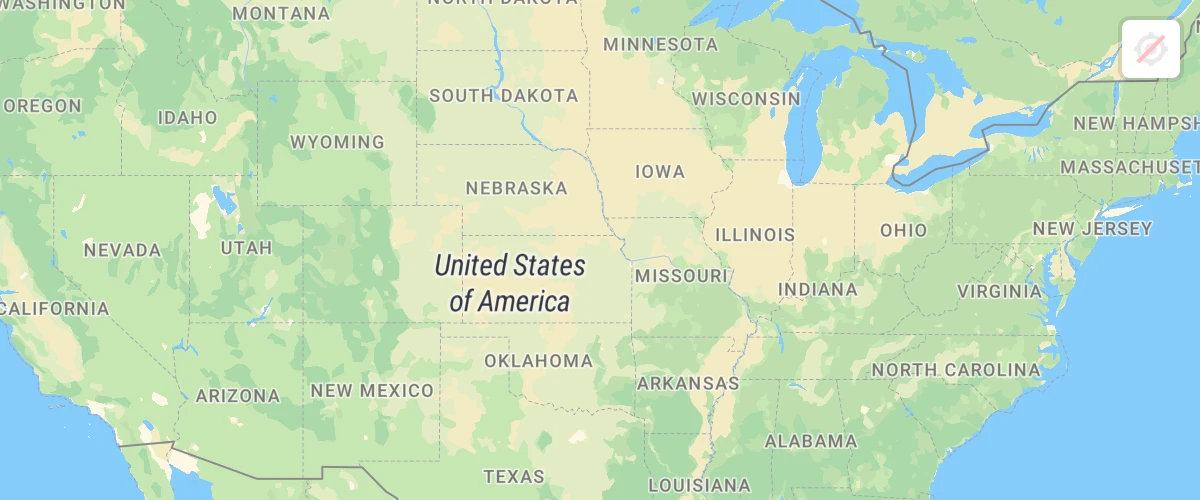
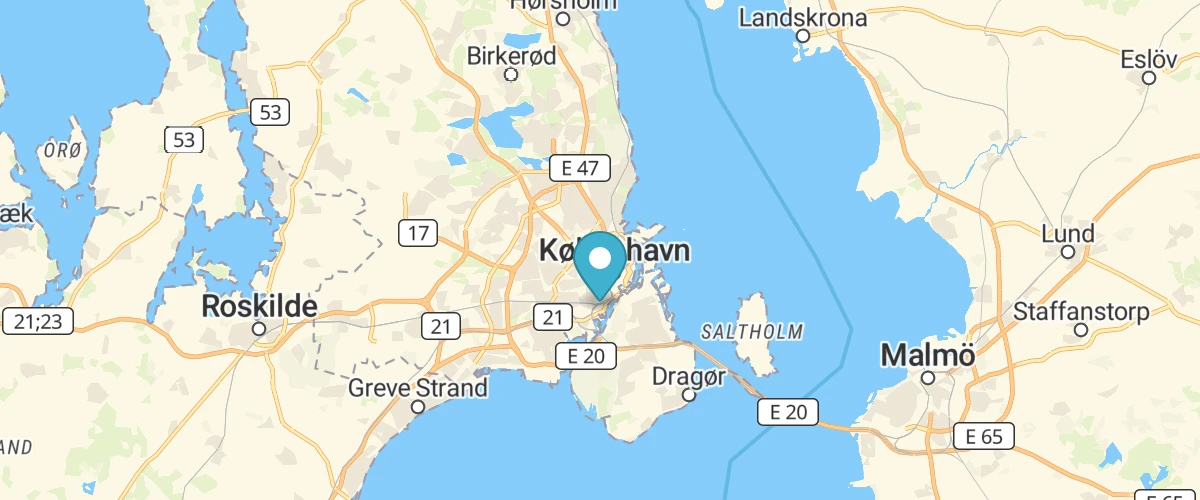
Locate the user
Geolocate the user and then track their current location on the map using the GeolocateControl.
Cooperative gestures
Enable cooperative gestures. See how it behaves in fullscreen mode.

Disable map rotation
Prevent users from rotating a map.
Disable scroll zoom
Prevent scroll from zooming a map.
Navigate the map with game-like controls
Use the keyboard's arrow keys to move around the map with game-like controls.
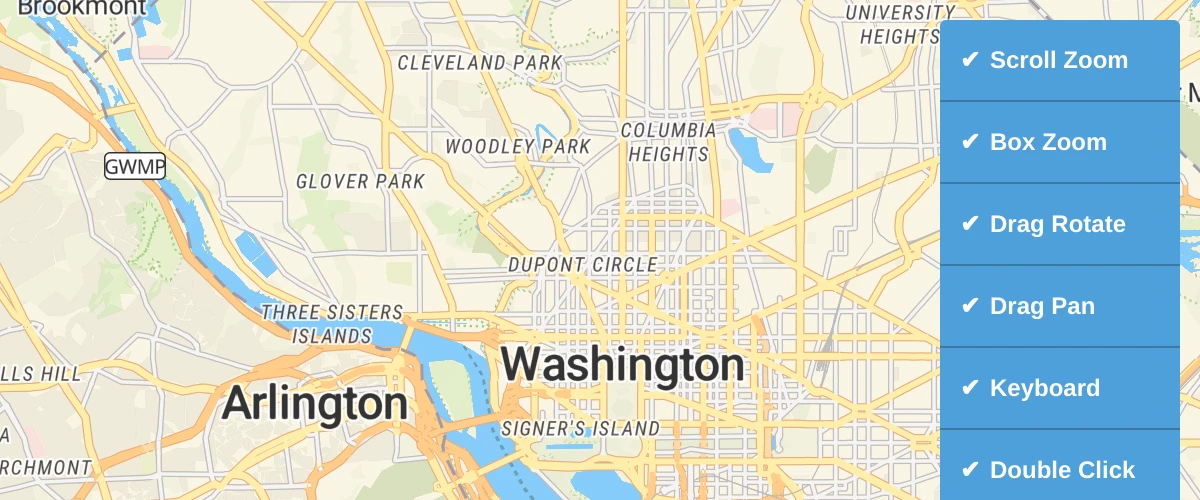
Toggle interactions
Enable or disable UI handlers on a map.
View a fullscreen map
Toggle between current view and fullscreen mode. Does not work on iPhones because a pseudo-fullscreen is used, and the code is embedded in an iframe, which prevents the map from scaling.
Sources
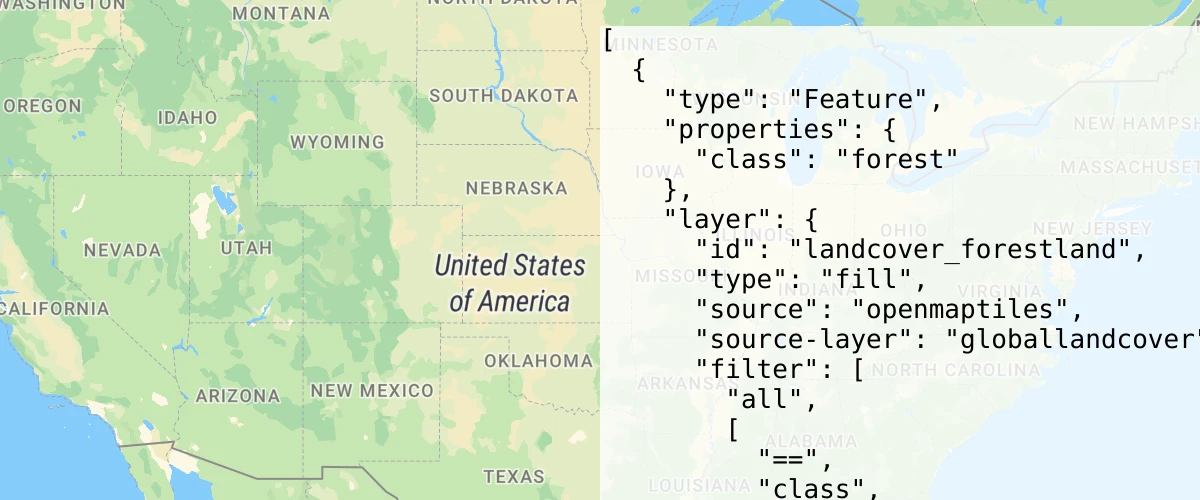
Add a vector tile source
Add a vector source to a map.
Add a GeoJSON line
Add a GeoJSON line to a map using addSource, then style it using addLayer’s paint properties.
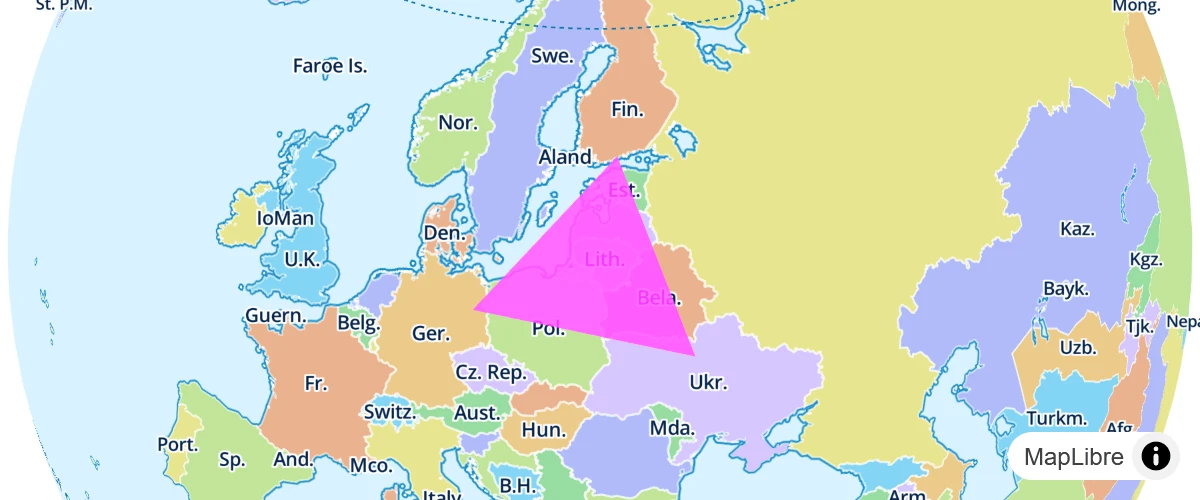
Add a GeoJSON polygon
Style a polygon with the fill layer type.
Draw GeoJSON points
Draw points from a GeoJSON collection to a map.
Add multiple geometries from one GeoJSON source
Add a polygon and circle layer from the same GeoJSON source.
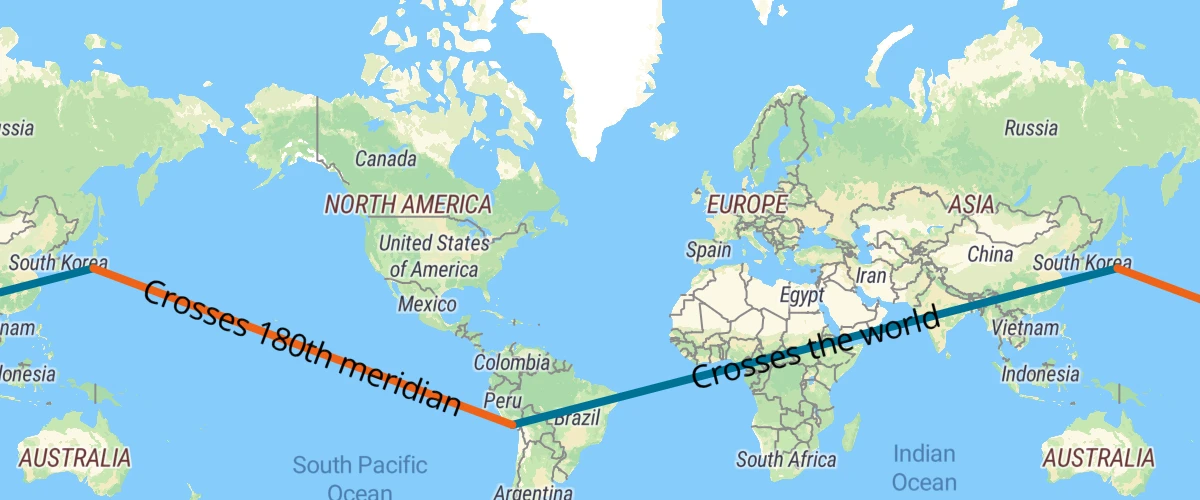
Display line that crosses 180th meridian
Draw a line across the 180th meridian using a GeoJSON source.
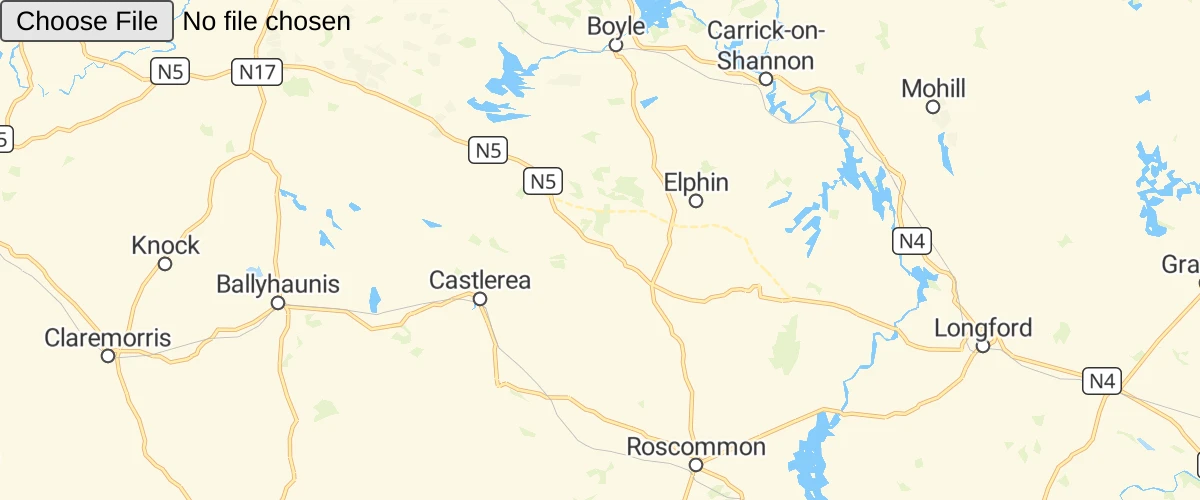
View local GeoJSON
View local GeoJSON without server upload.
View local GeoJSON (experimental)
View local GeoJSON with experimental File System Access API.
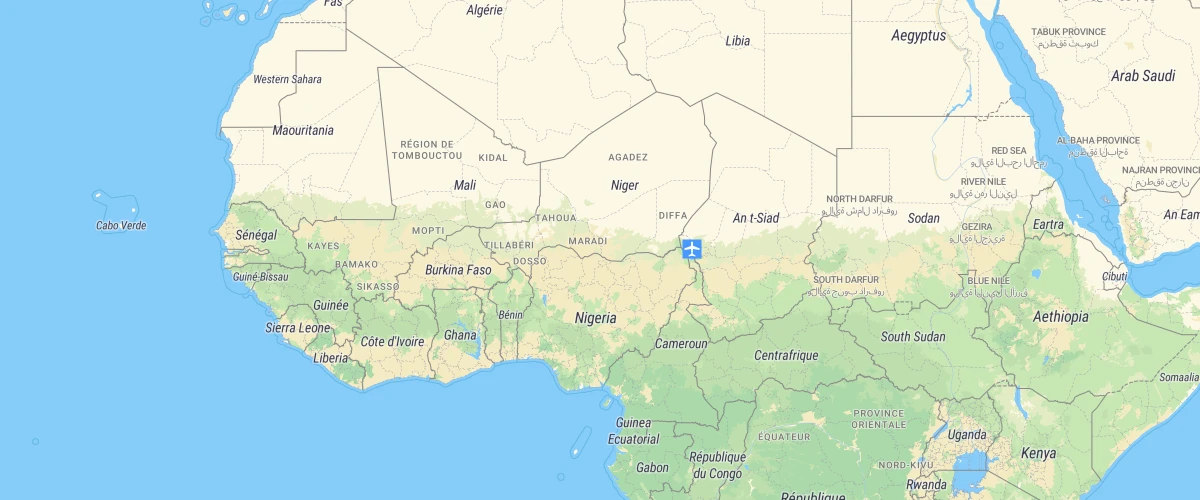
Add a raster tile source
Add a third-party raster source to the map.
Add a WMS source
Add an external Web Map Service raster layer to the map using addSource's tiles option.
Add a canvas source
Add a canvas source to the map.
Add a COG raster source
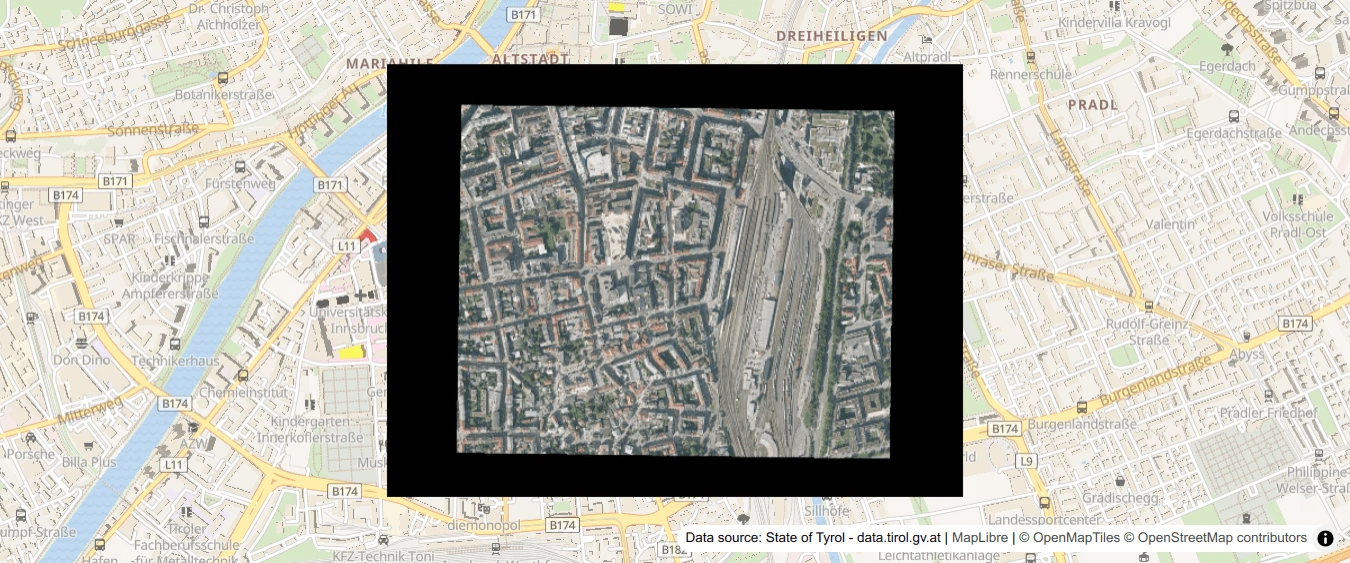
Add an external Cloud Optimized Geotiff (COG) as source.
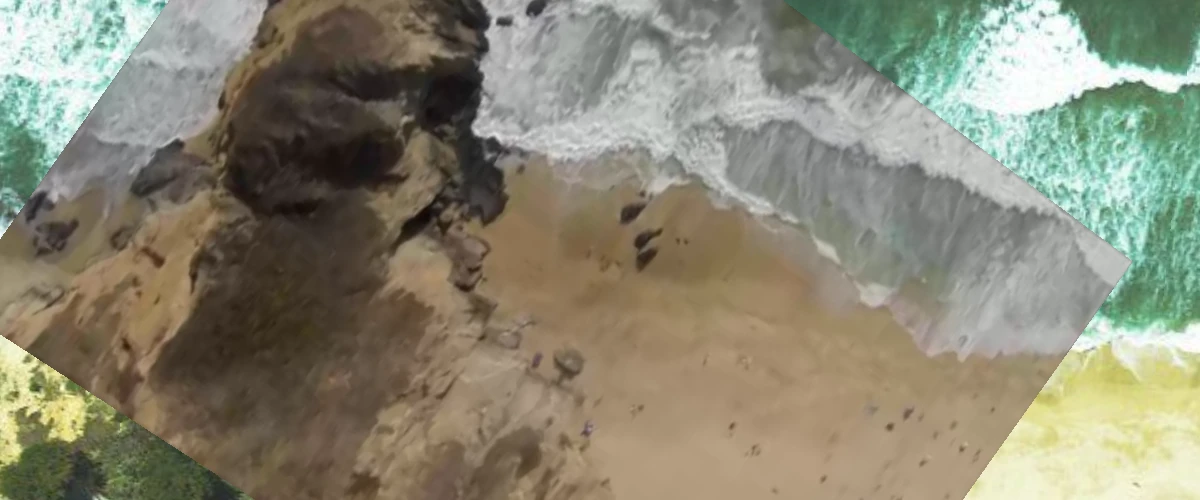
Add a video
Display a video on top of a satellite raster baselayer.
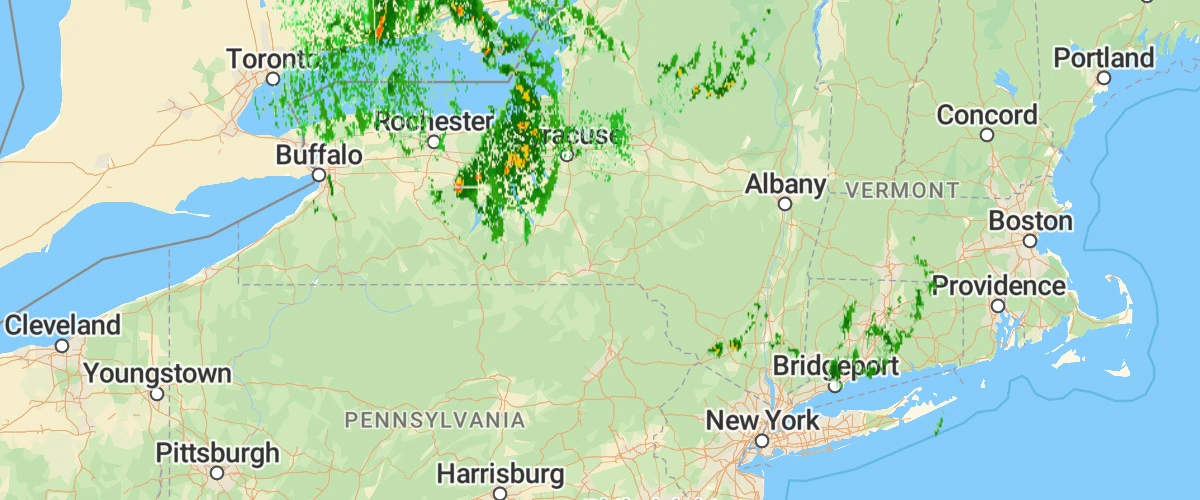
Animate a series of images
Use a series of image sources to create an animation.
Layers
Add an icon to the map
Add an icon to the map from an external URL and use it in a symbol layer.
Add a generated icon to the map
Add an icon to the map that was generated at runtime.
Add a stretchable image to the map
Use a stretchable image as a background for text.
Add an animated icon to the map
Add an animated icon to the map that was generated at runtime with the Canvas API.
Display a remote SVG symbol
Uses a missing style image resolver to load a remote image and use it.
Generate and add a missing icon to the map
Dynamically generate a missing icon at runtime and add it to the map.
Use a fallback image
Use a coalesce expression to display another image when a requested image is not available.
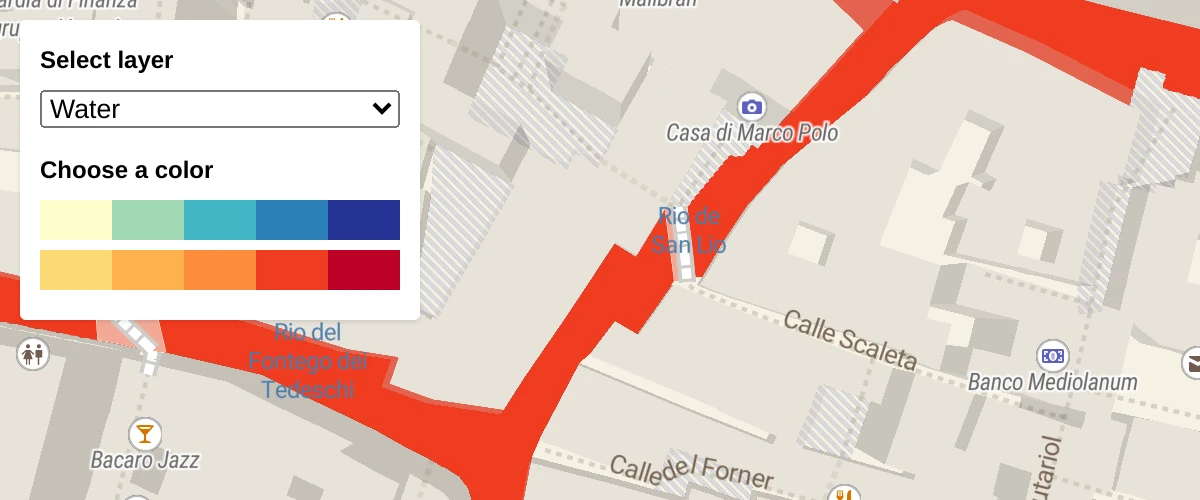
Change a layer's color with buttons
Use setPaintProperty to change a layer's fill color.
Add a new layer below labels
Use the second argument of addLayer to add a layer below labels.
Add a custom style layer
Use a custom style layer to render custom WebGL content.
Add a pattern to a polygon
Use fill-pattern to draw a polygon from a repeating image pattern.
Style lines with a data-driven property
Create a visualization with a data expression for line-color.
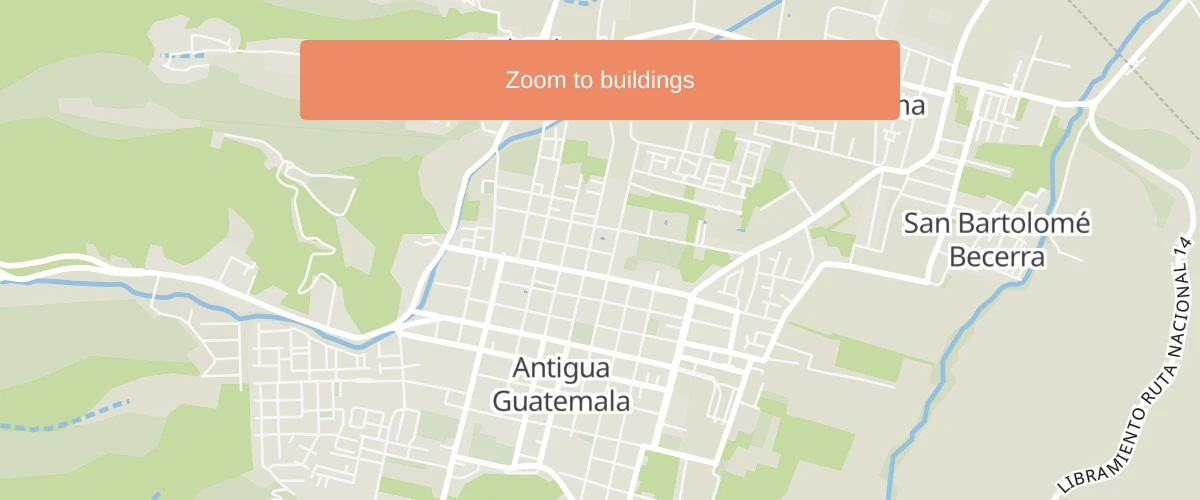
Change building color based on zoom level
Use the interpolate expression to ease-in the building layer and smoothly fade from one color to the next.
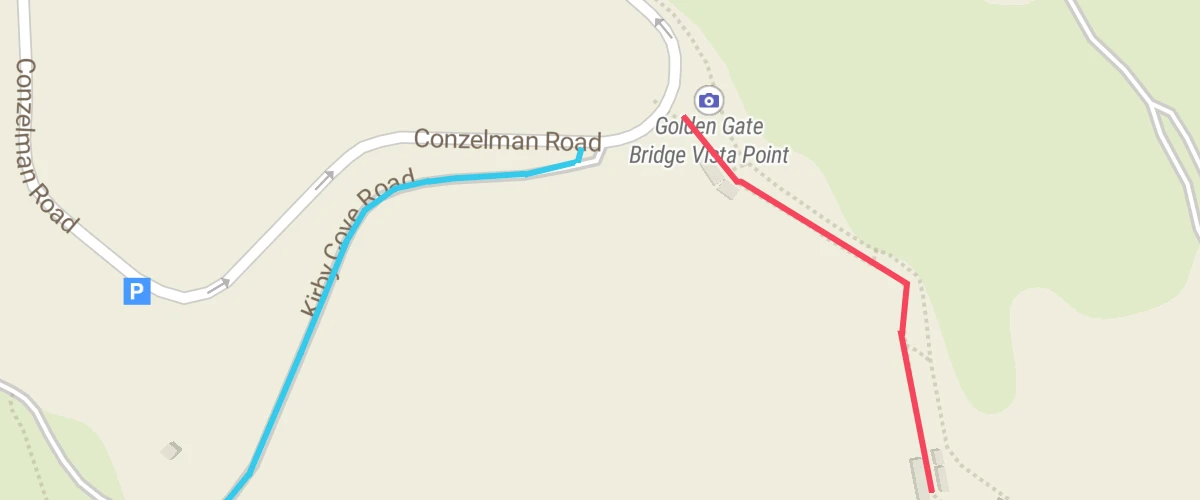
Create a gradient dashed line using an expression
Use the line-gradient and line-dasharray paint properties together to create a dashed line with gradient colors.
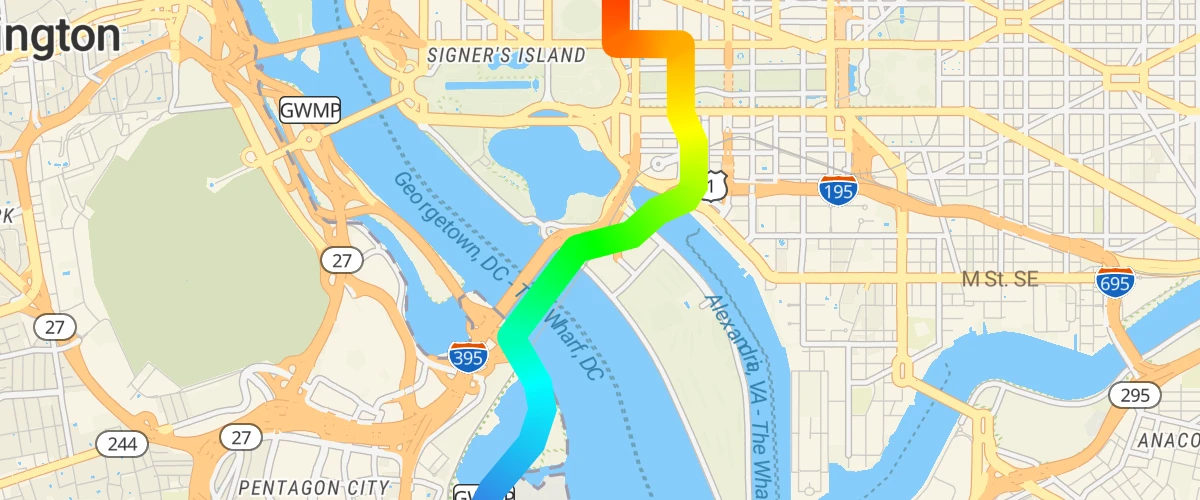
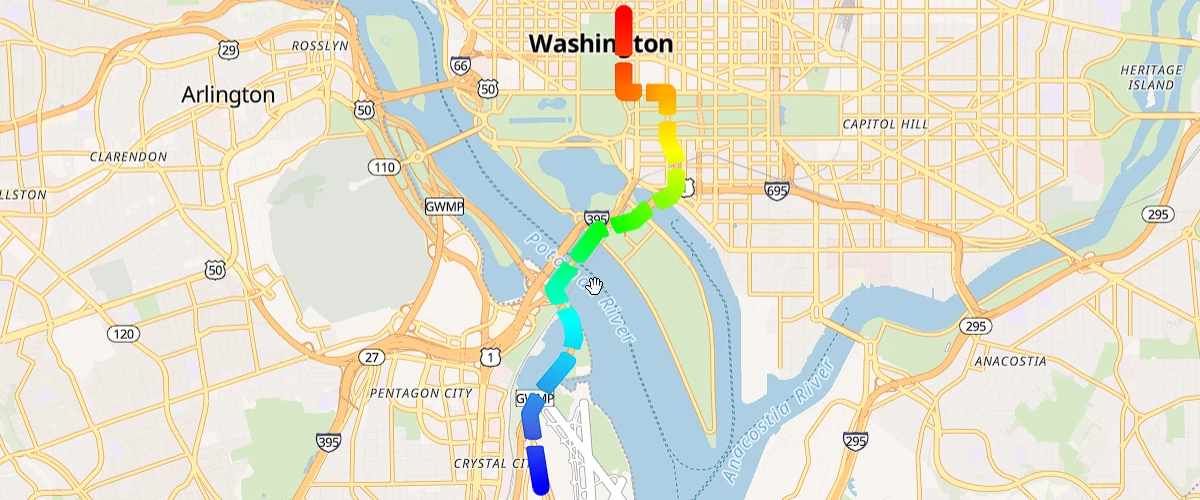
Create a gradient line using an expression
Use the line-gradient paint property and an expression to visualize distance from the starting point of a line.
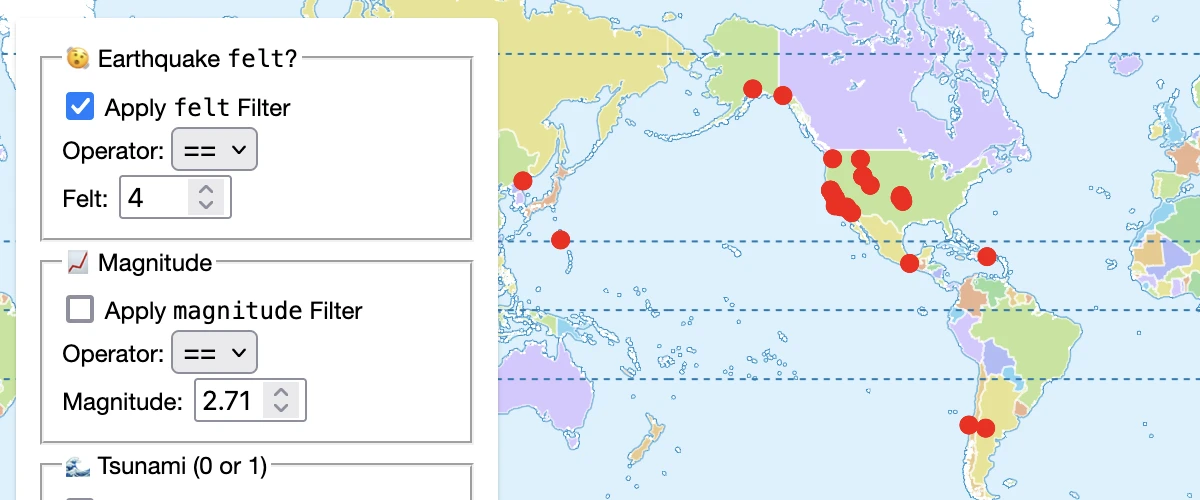
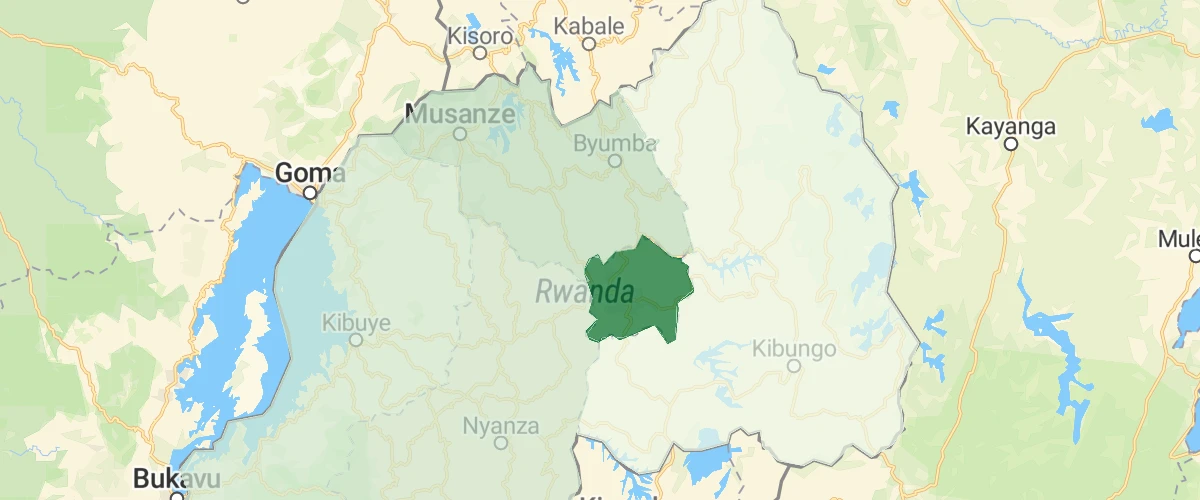
Filter within a Layer
Filter a layer based on user input using setFilter().
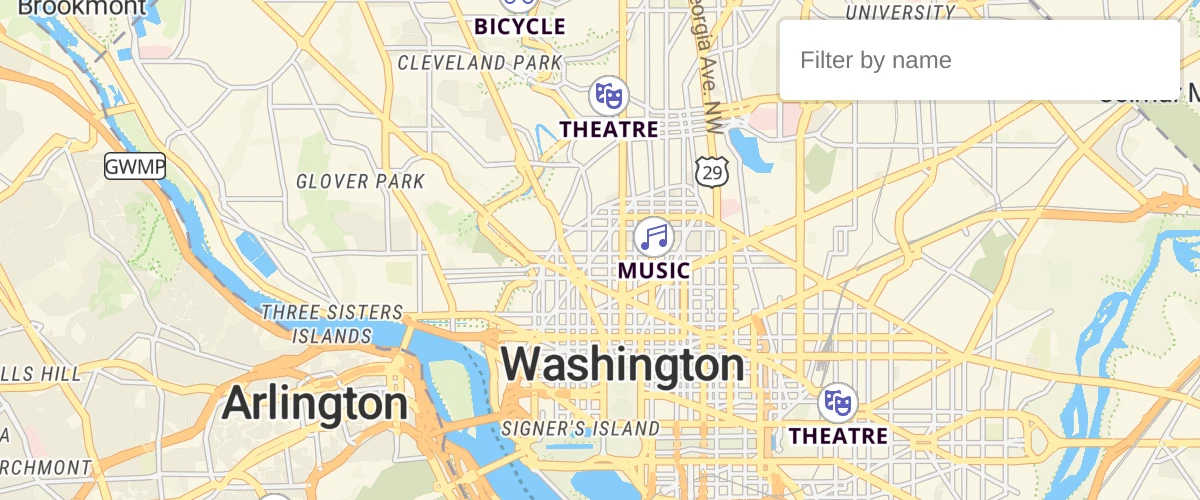
Filter symbols by text input
Filter symbols by icon name by typing in a text input.
Filter layer symbols using global state
Filter a layer symbols based on user input using setGlobalStateProperty().
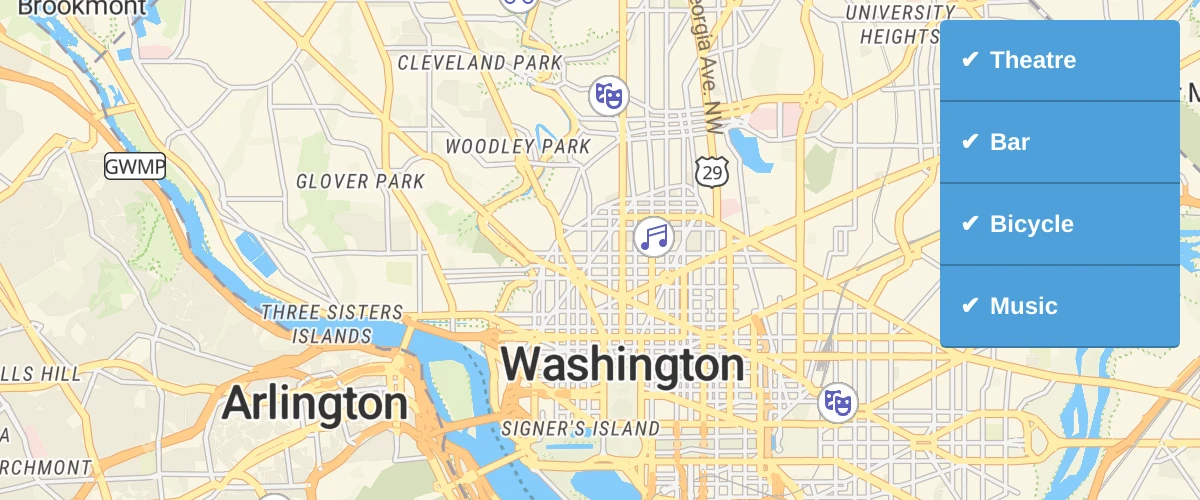
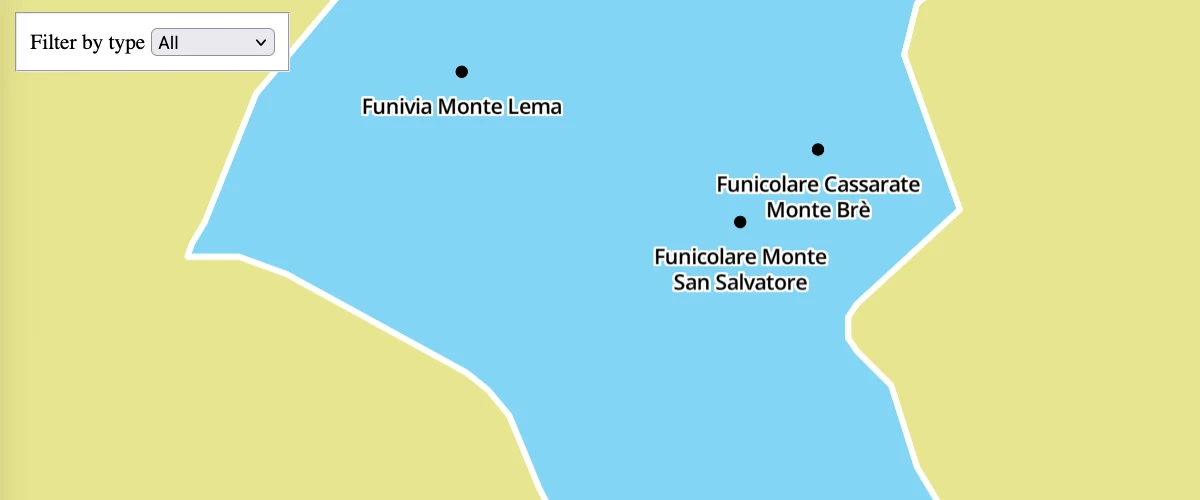
Filter symbols by toggling a list
Filter a set of symbols based on a property value in the data.
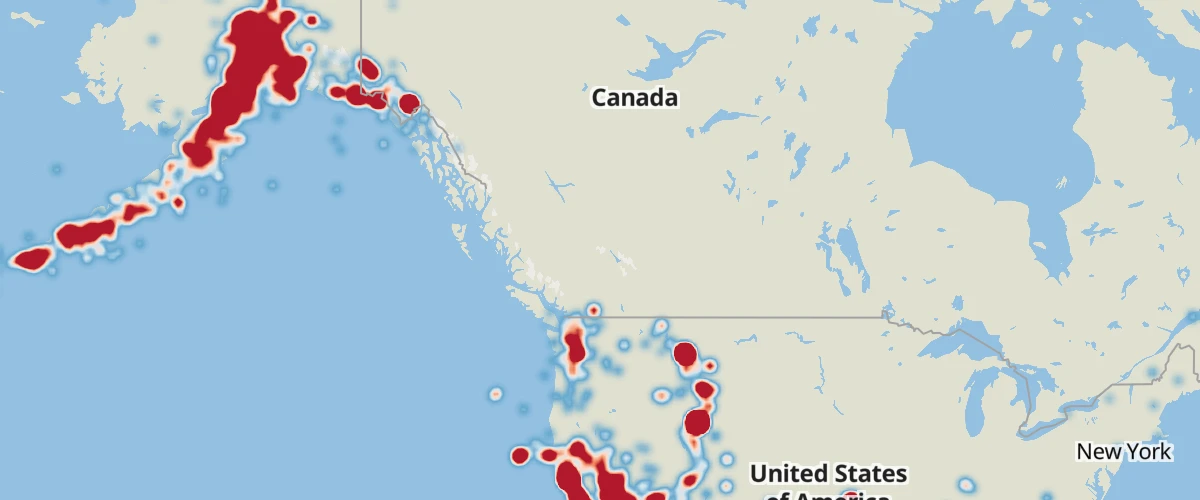
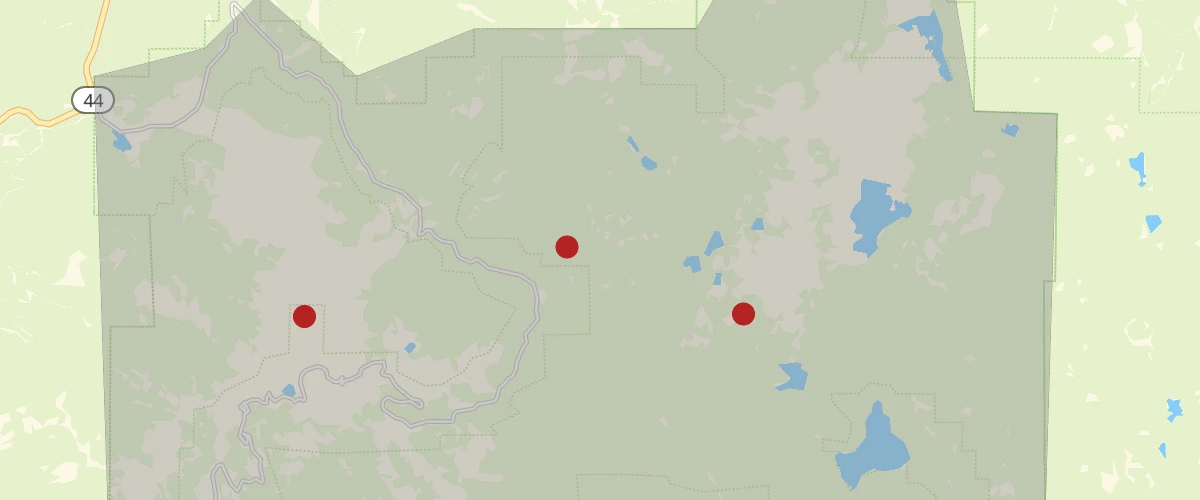
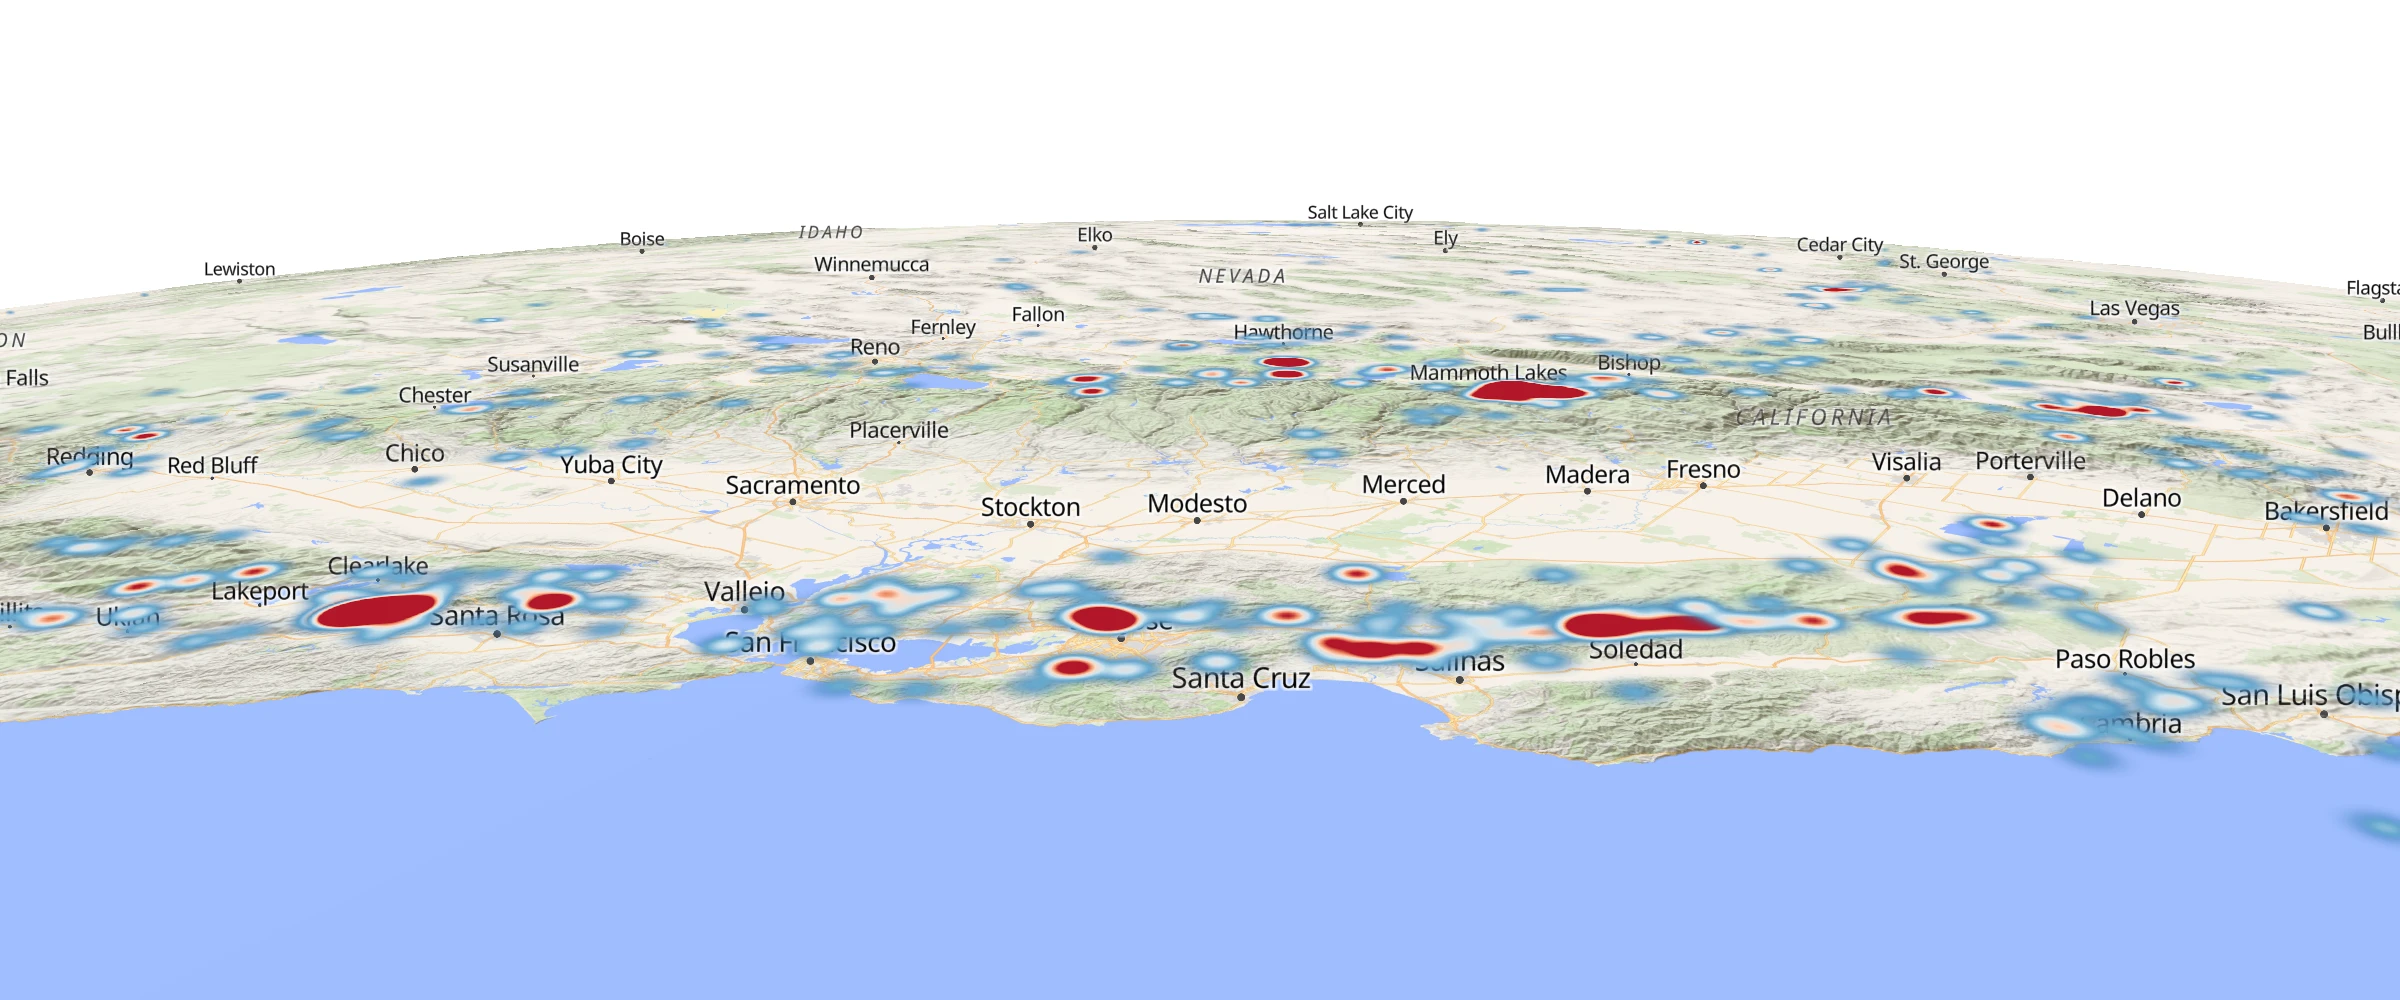
Create a heatmap layer
Visualize earthquake frequency by location using a heatmap layer.
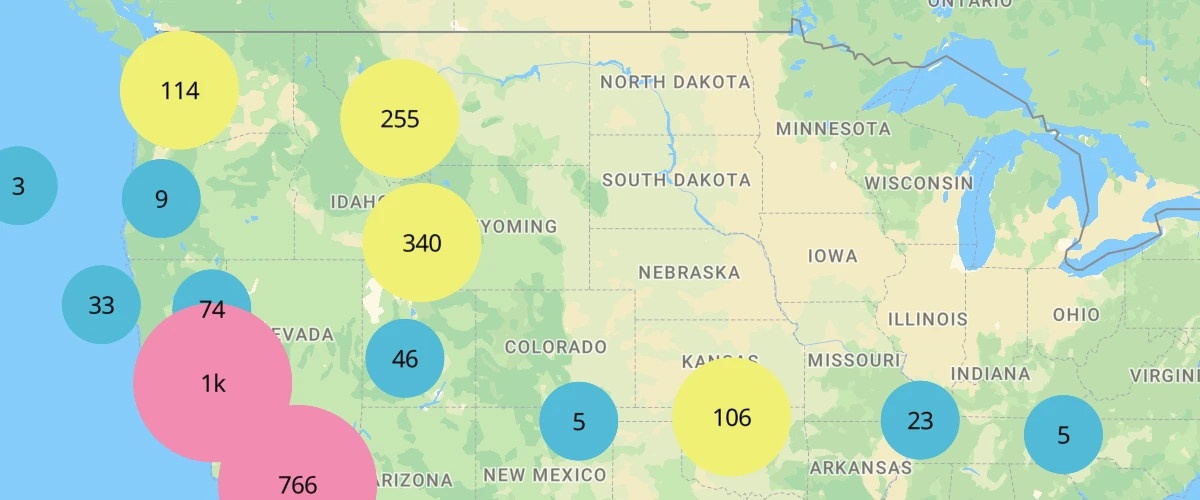
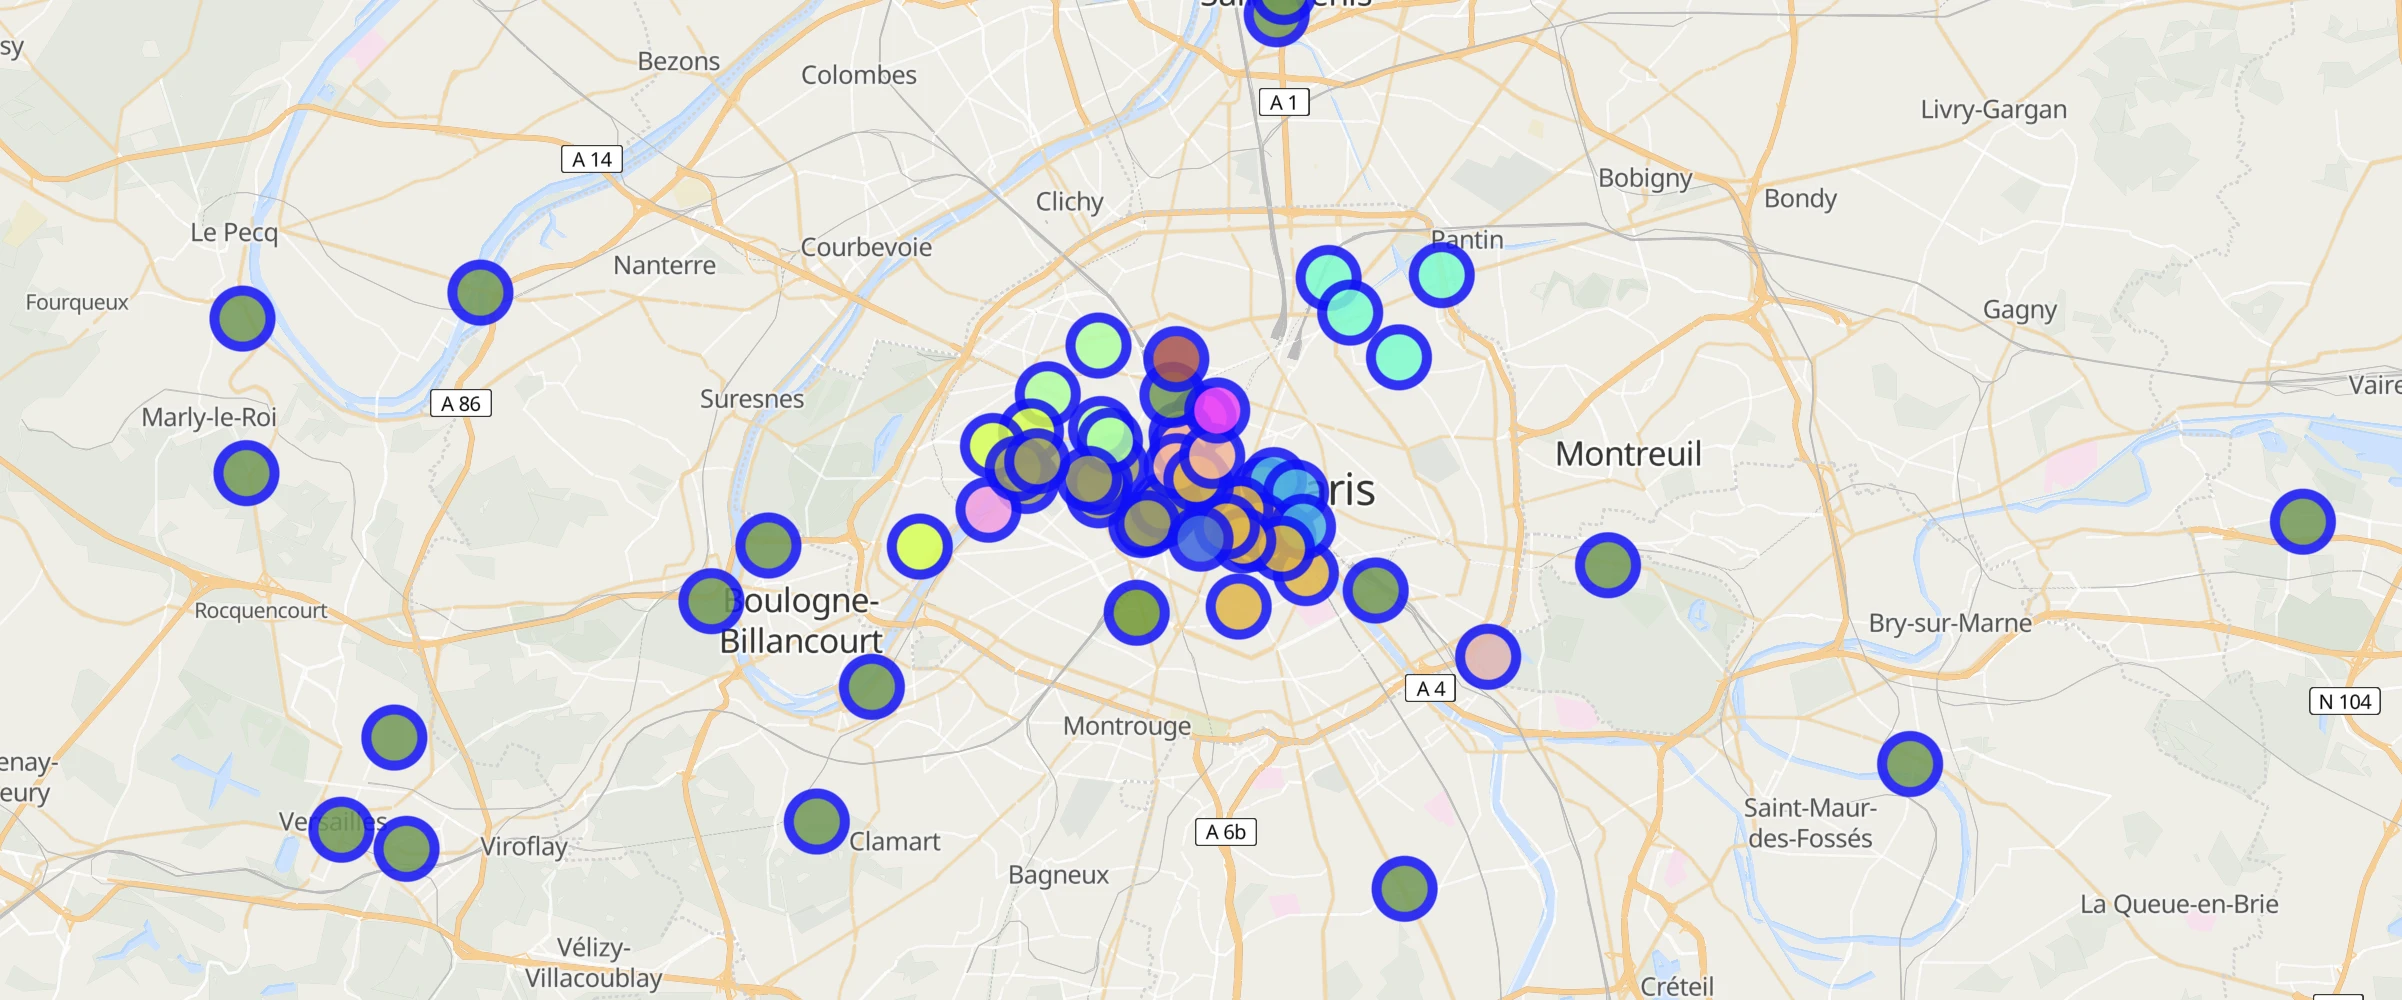
Create and style clusters
Use MapLibre GL JS' built-in functions to visualize points as clusters.
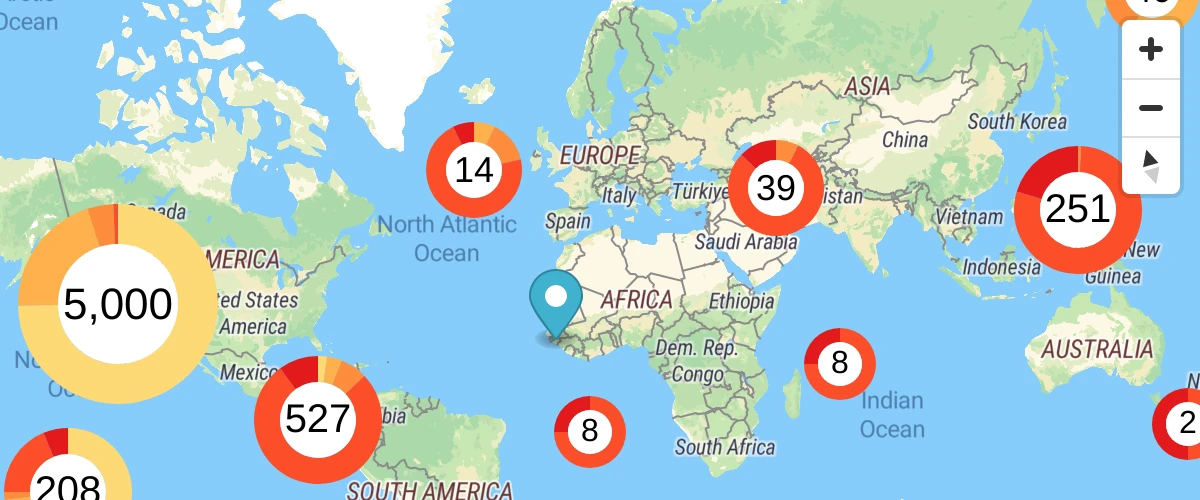
Display HTML clusters with custom properties
Extend clustering with HTML markers and custom property expressions.
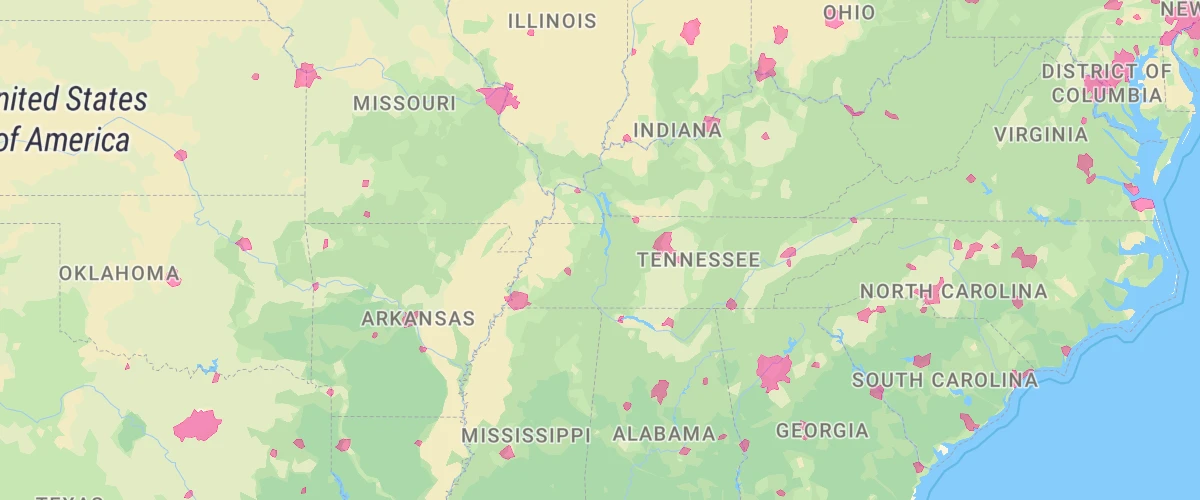
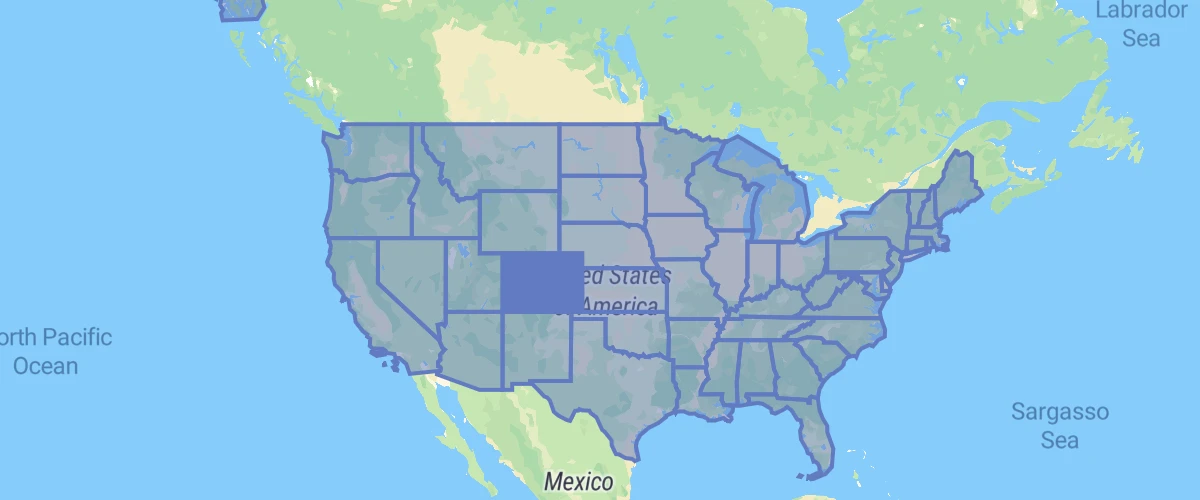
Visualize population density
Use a variable binding expression to calculate and display population density.
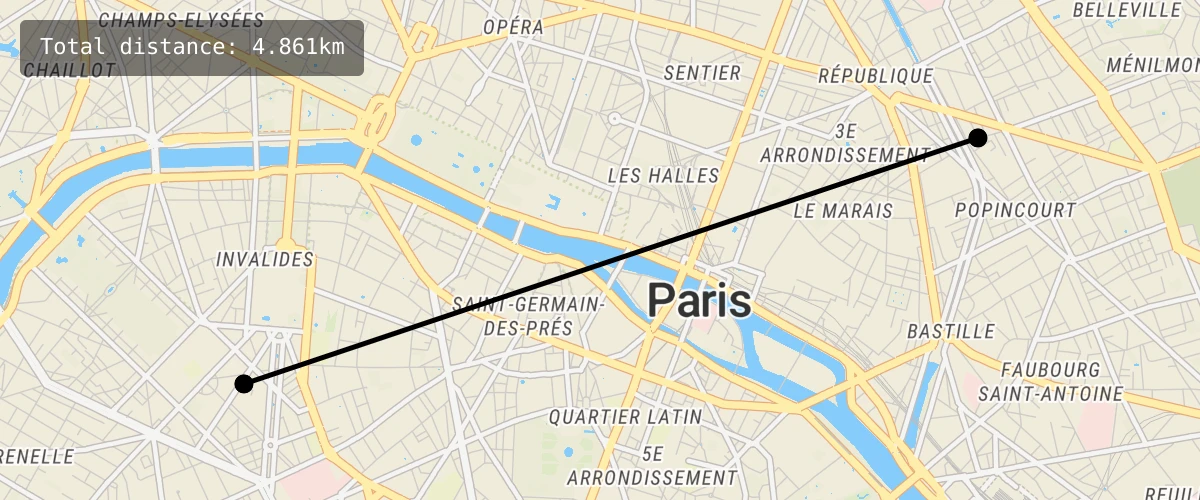
Measure distances
Click points on a map to create lines that measure distanced using turf.length.
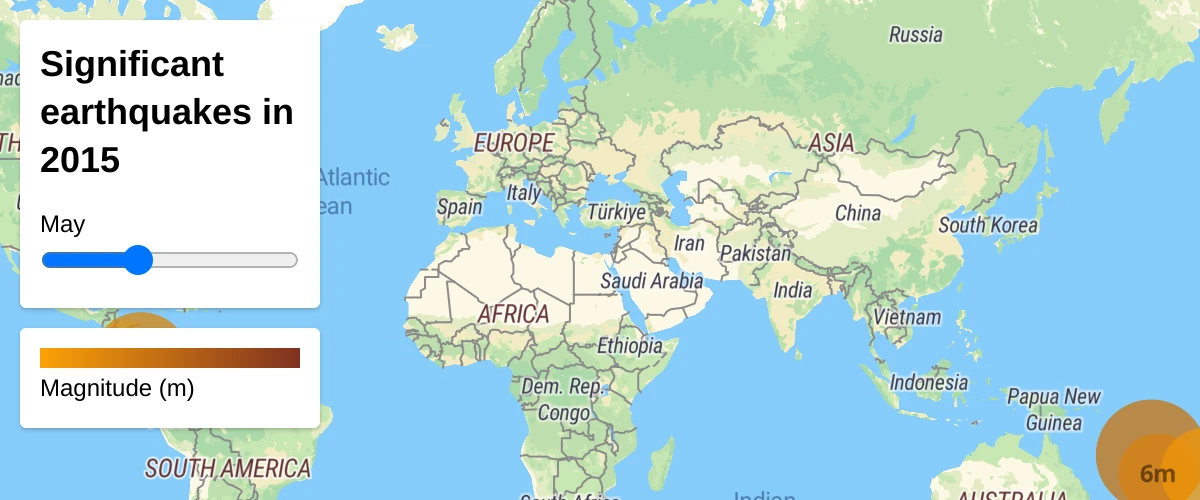
Create a time slider
Visualize earthquakes with a range slider.
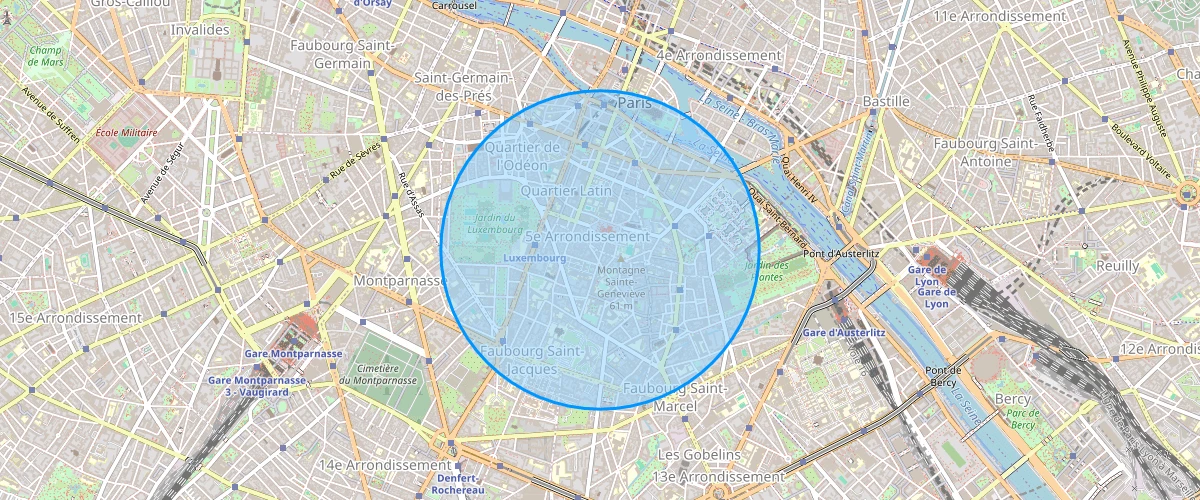
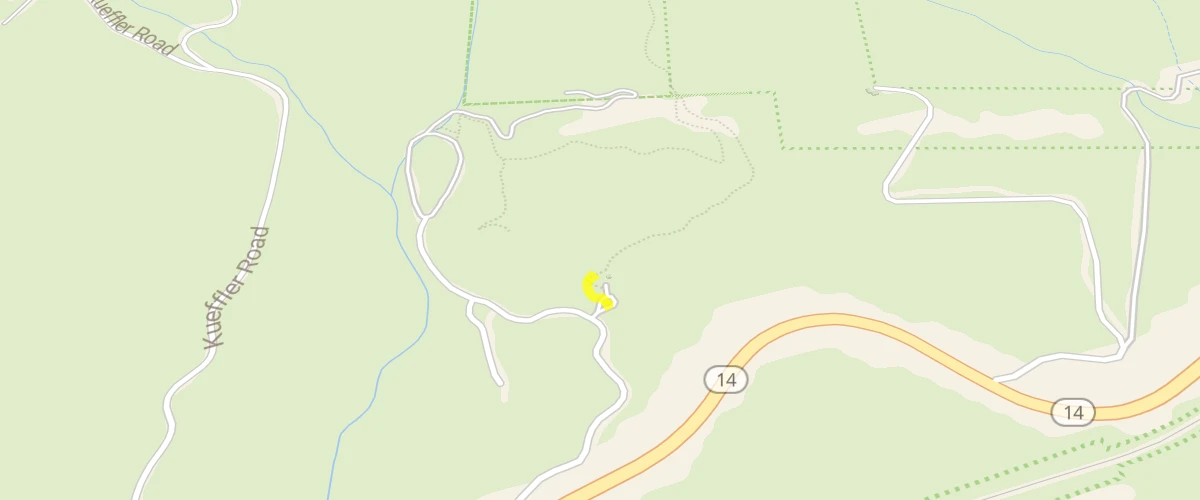
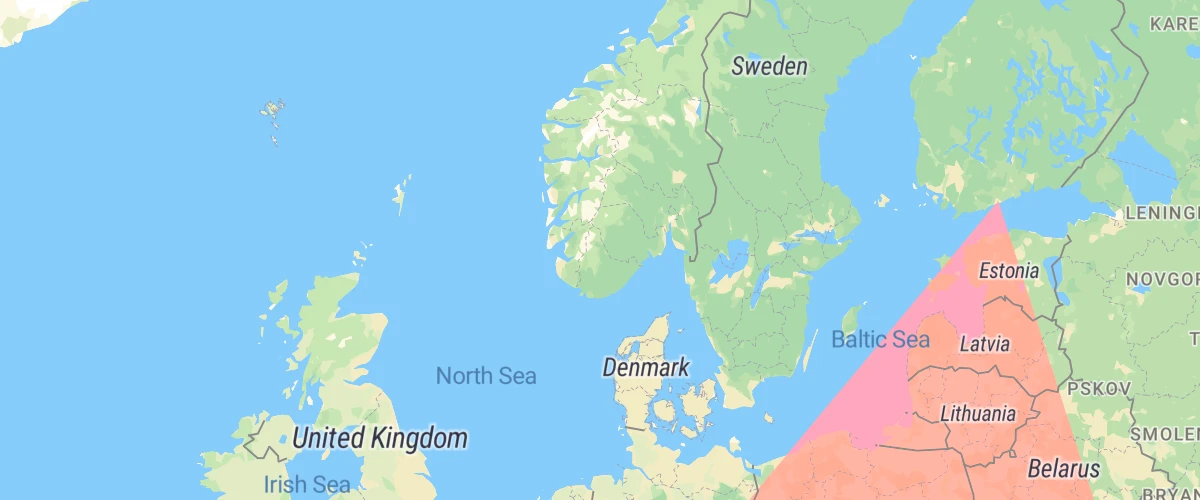
Draw a Circle
Draw a radius to approximate a location with Turf.js
3D Terrain
Go beyond hillshade and show elevation in actual 3D.
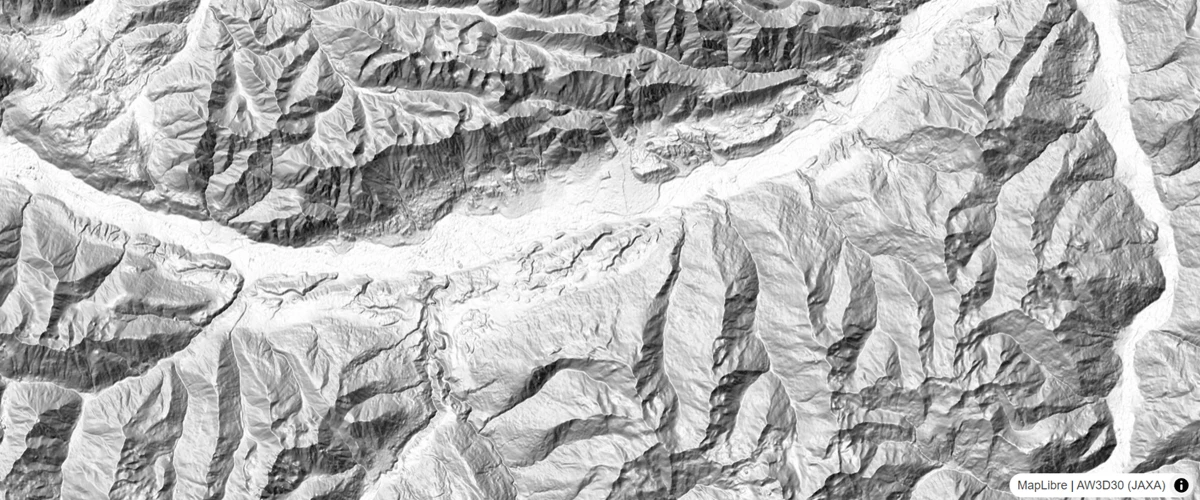
Add a hillshade layer
Add a simple hillshade layer.
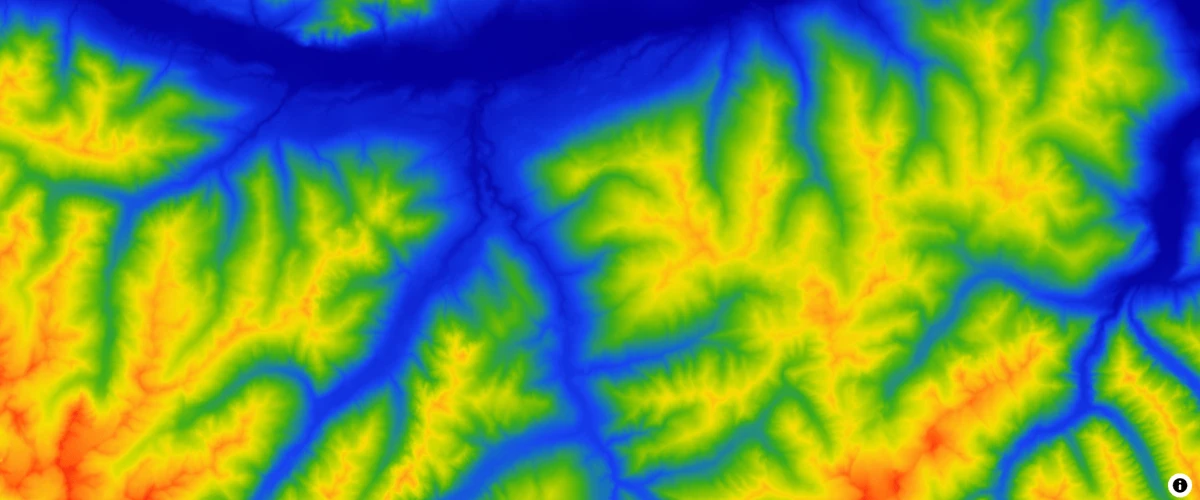
Add a color relief layer
Add a color relief layer.
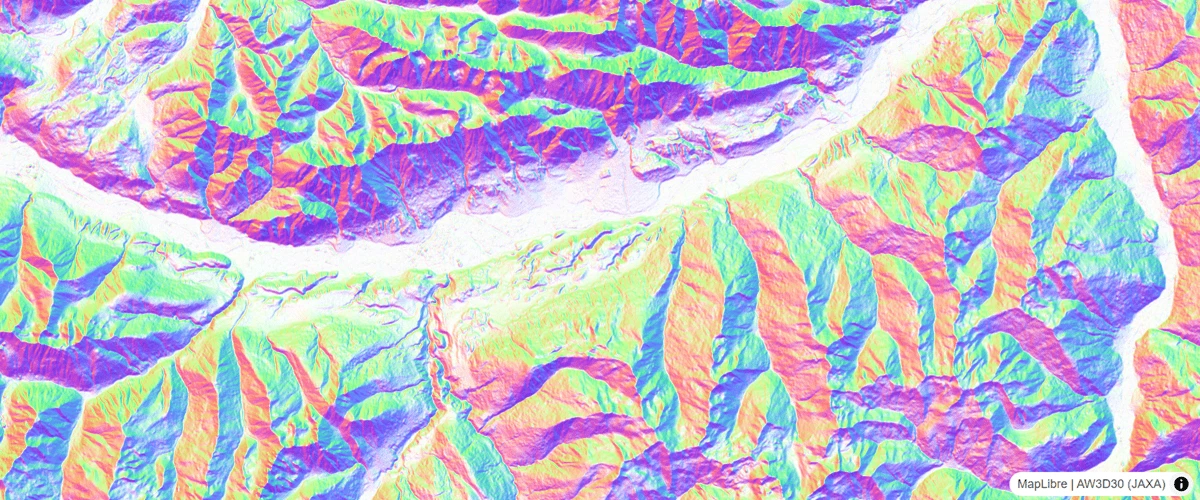
Add a multidirectional hillshade layer
Add a hillshade layer with multiple illumination sources.
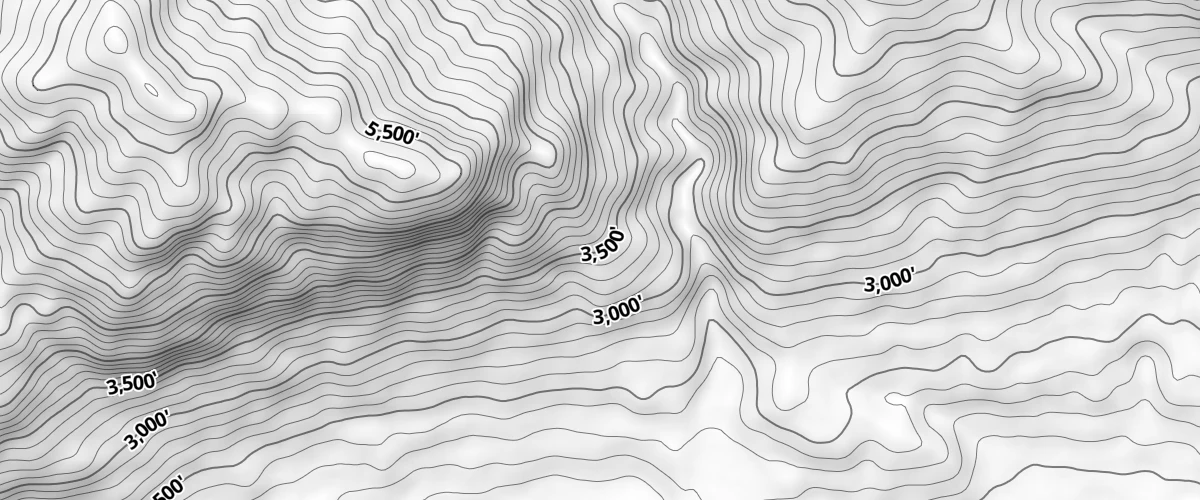
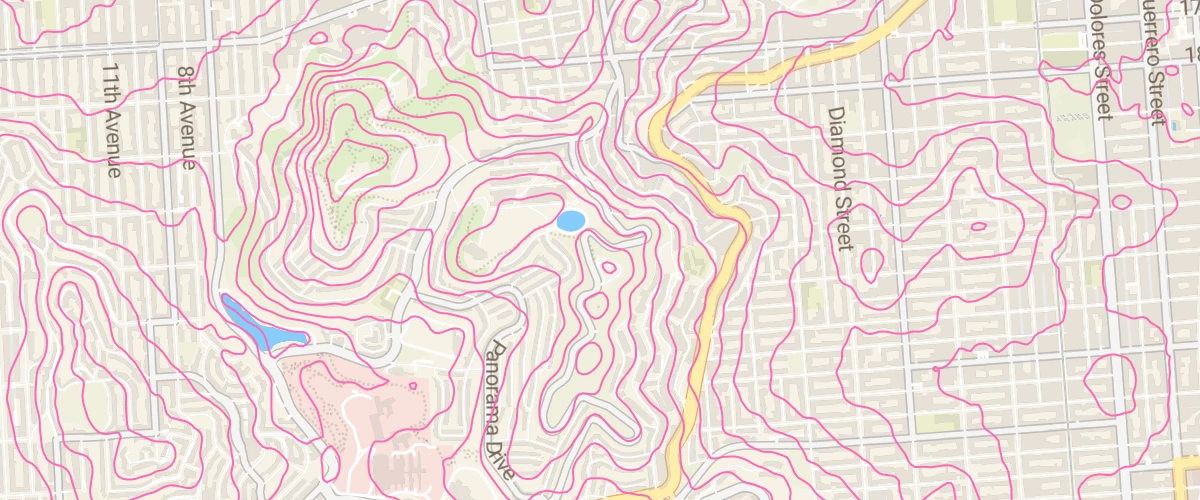
Add Contour Lines
Add contour lines to your map from a raster-dem source.
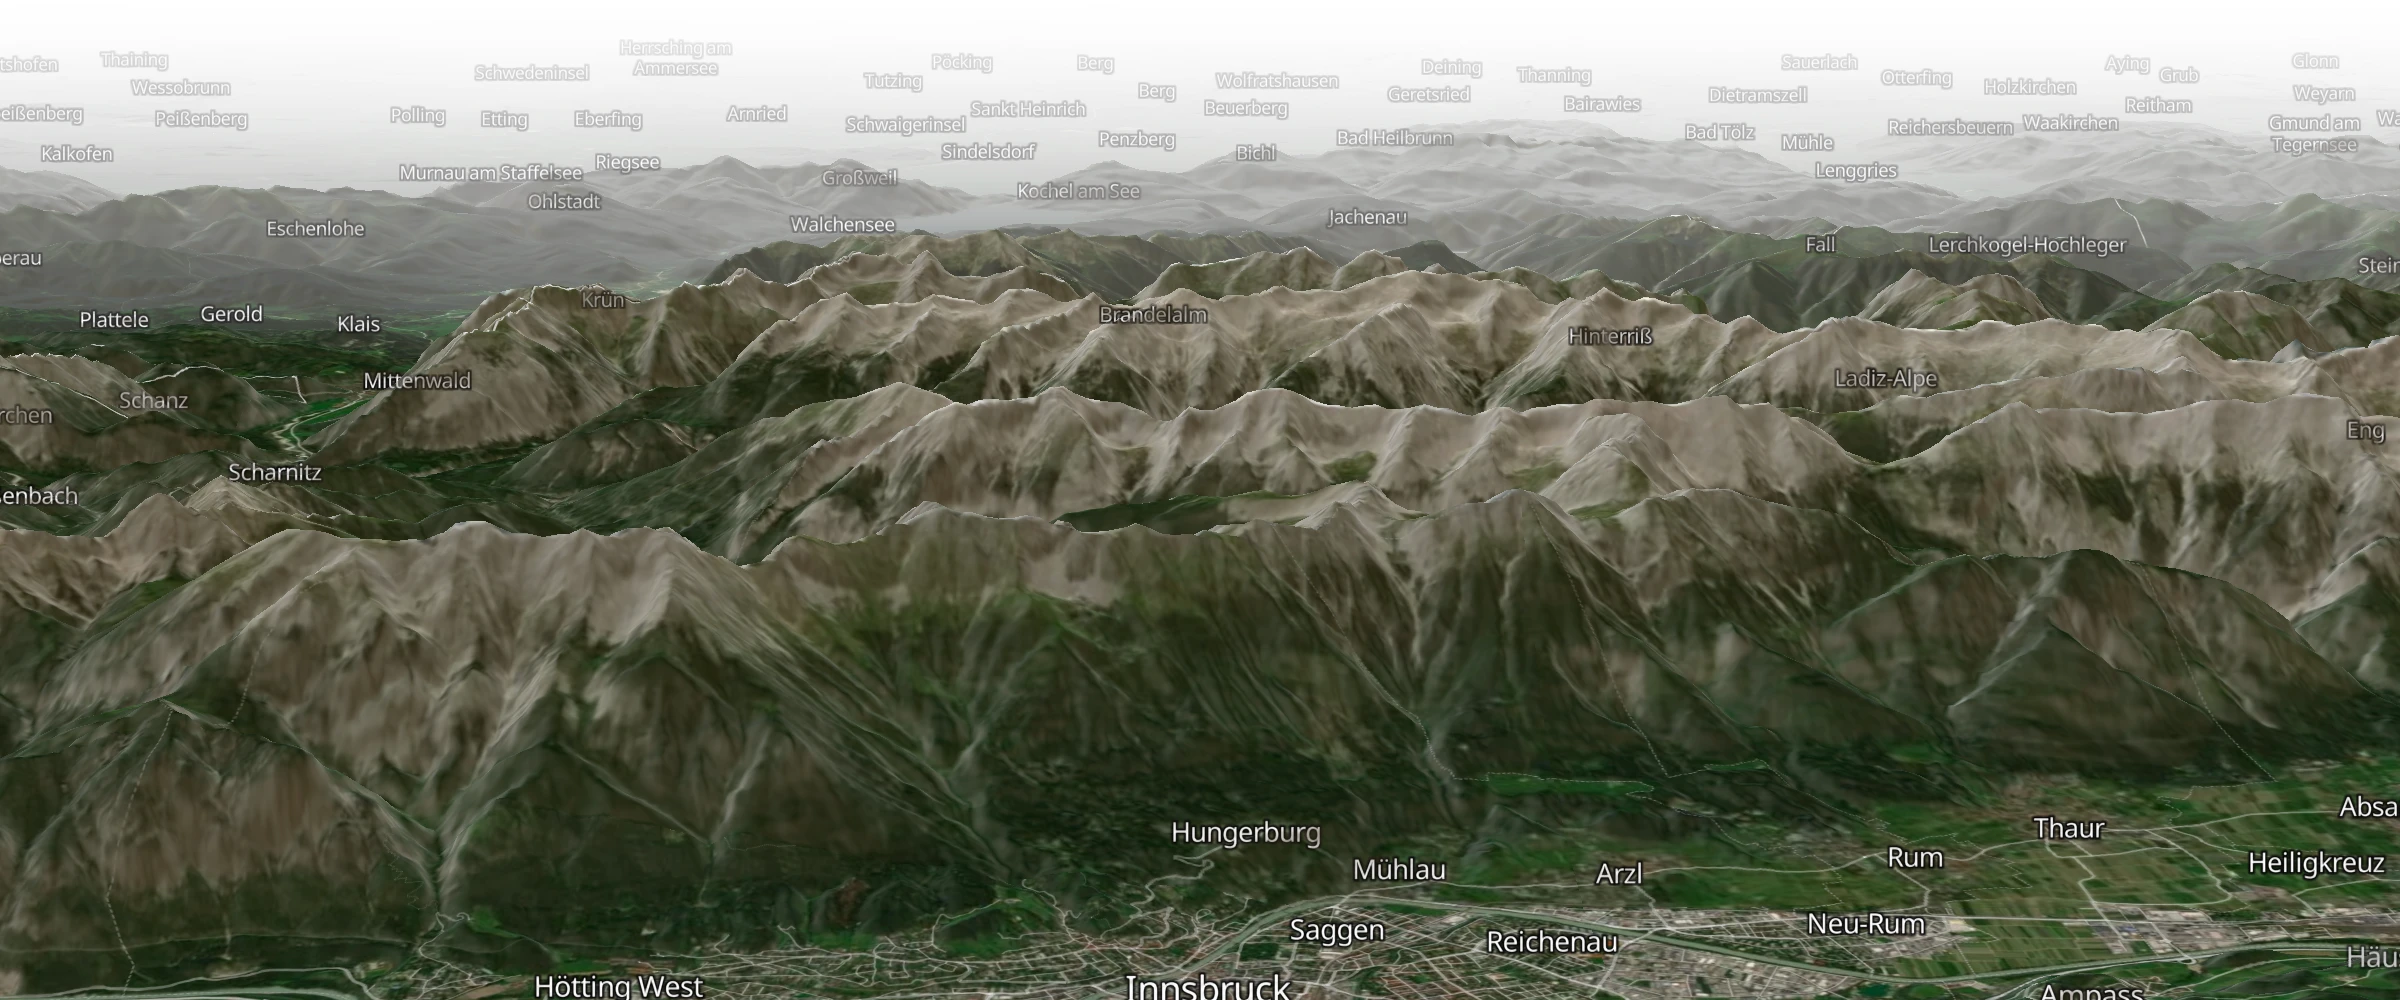
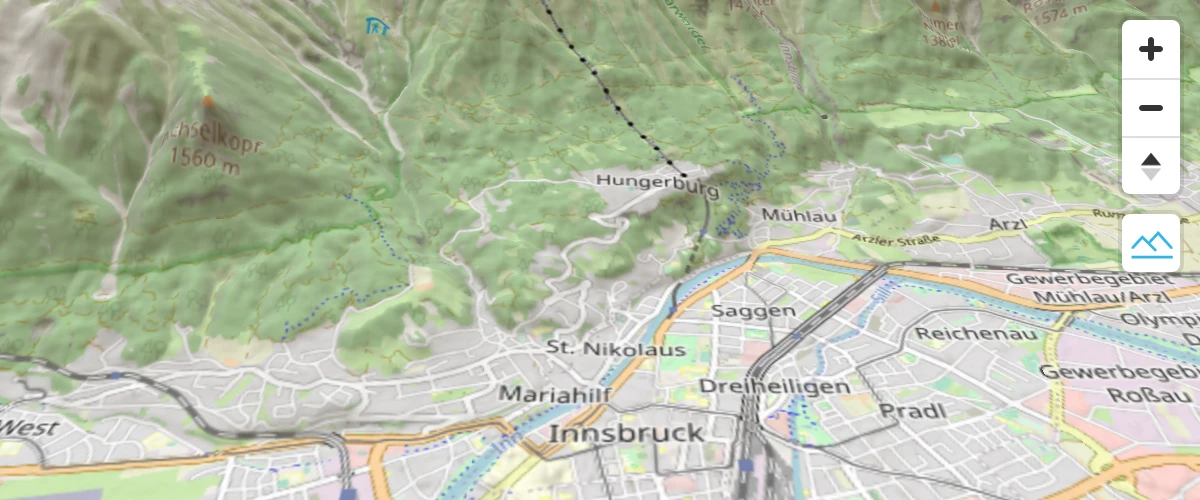
Display a hybrid satellite map with terrain elevation
Display a hybrid satellite map with terrain elevation.
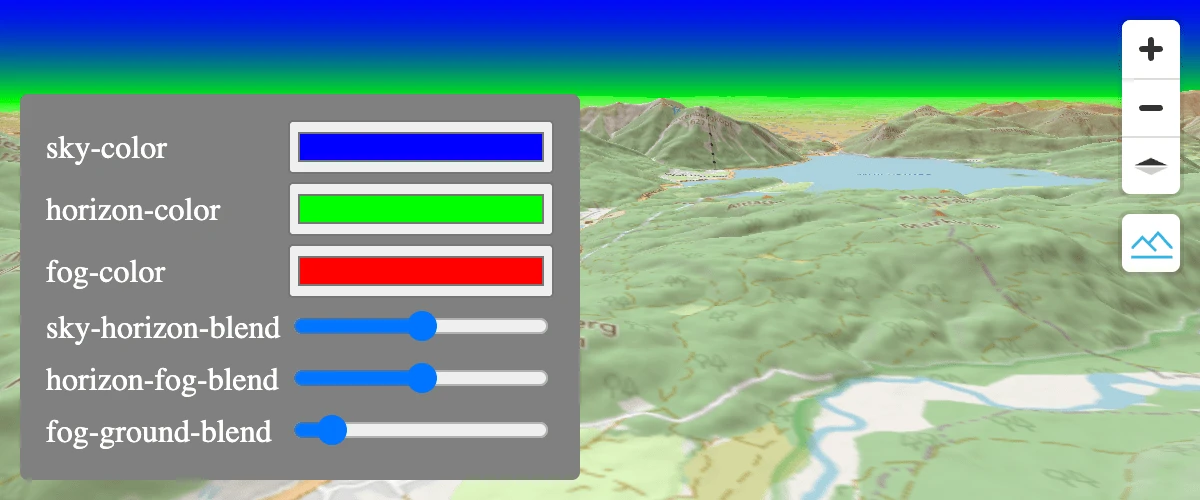
Sky, Fog, Terrain
Allows changing the sky, fog and horizon color and blends.
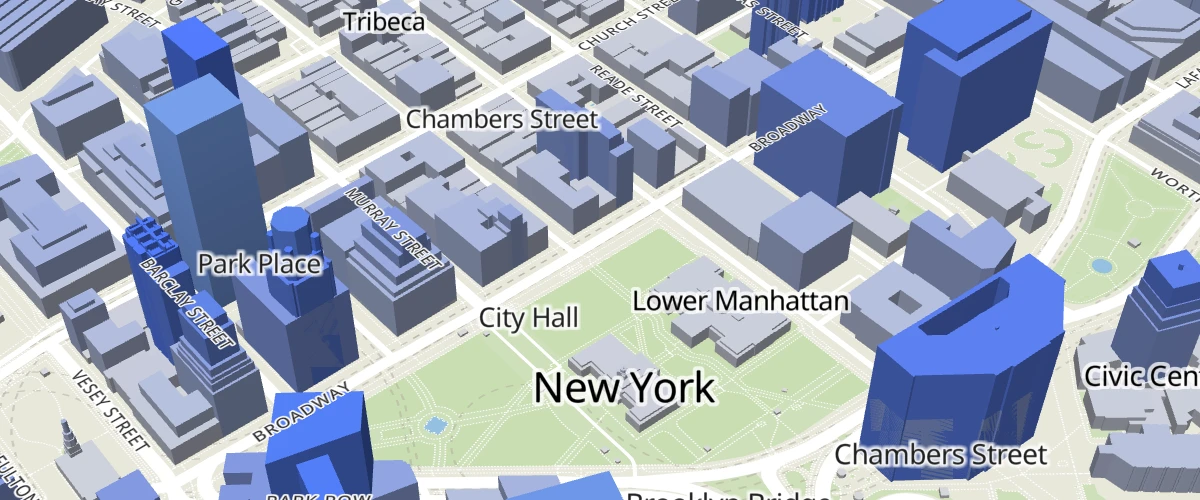
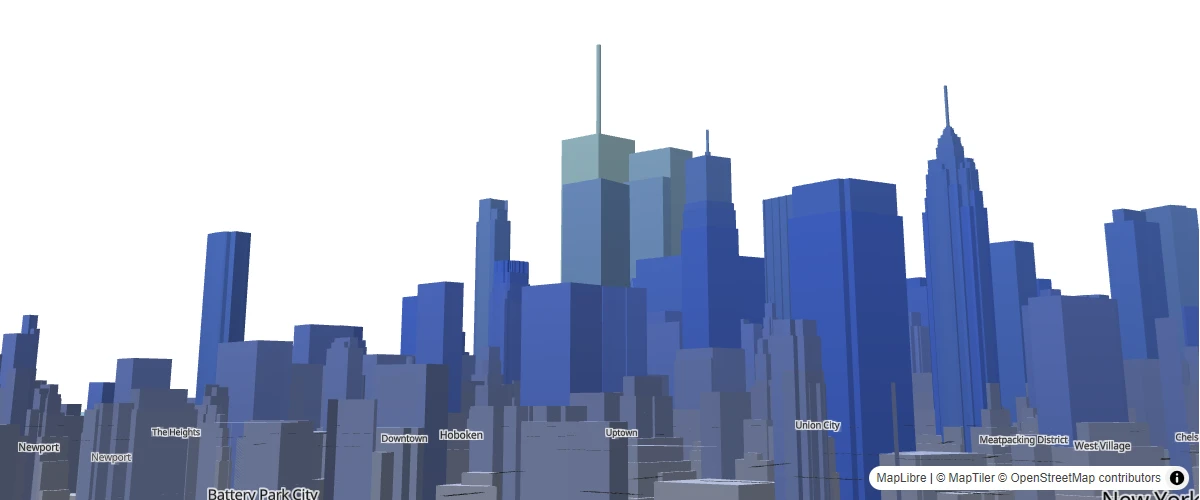
Display buildings in 3D
Use extrusions to display buildings' height in 3D.
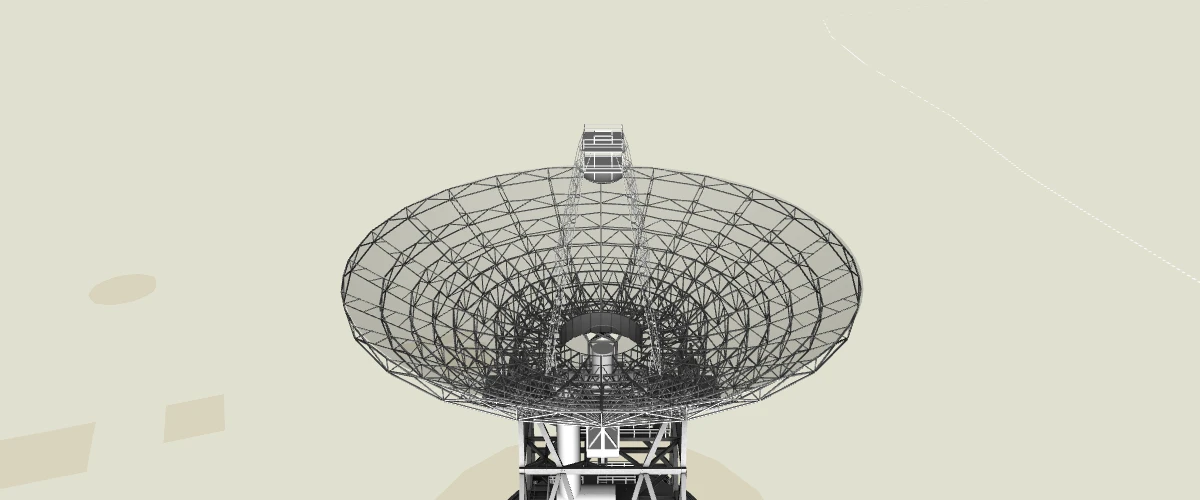
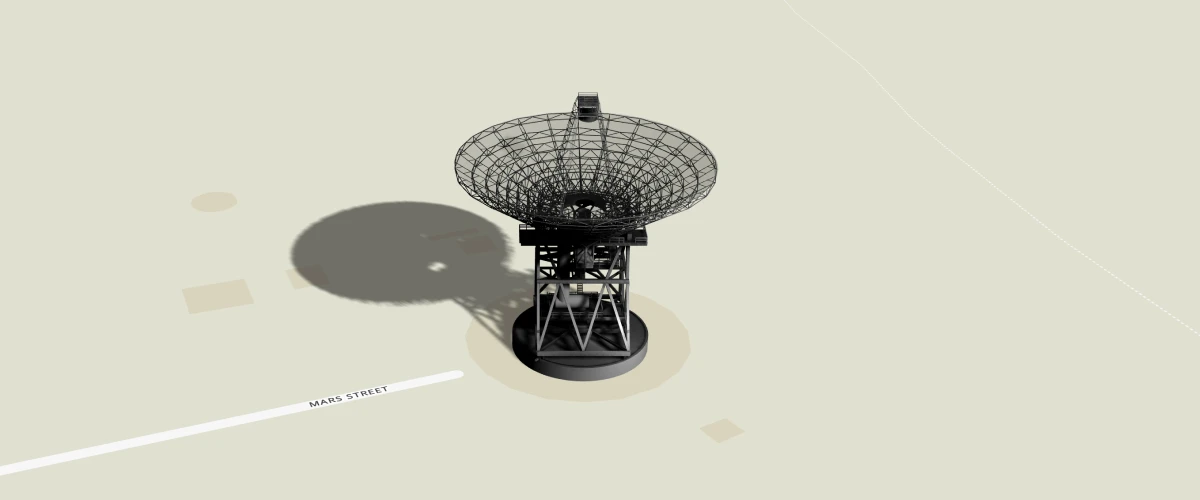
Add a 3D model using three.js
Use a custom style layer with three.js to add a 3D model to the map.
 new
new
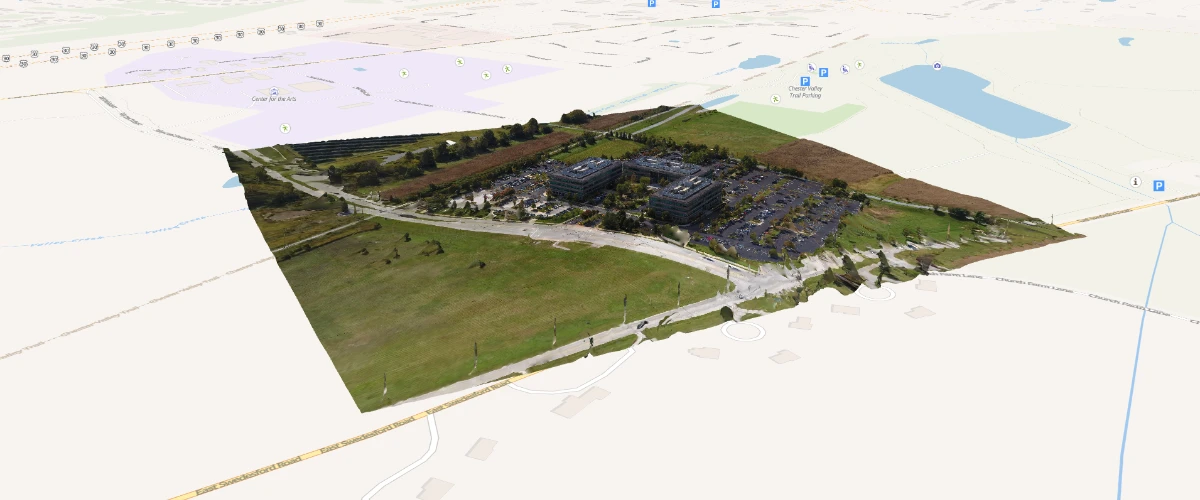
Add 3D tiles using three.js
Use a custom style layer with three.js to add 3D tiles to the map.
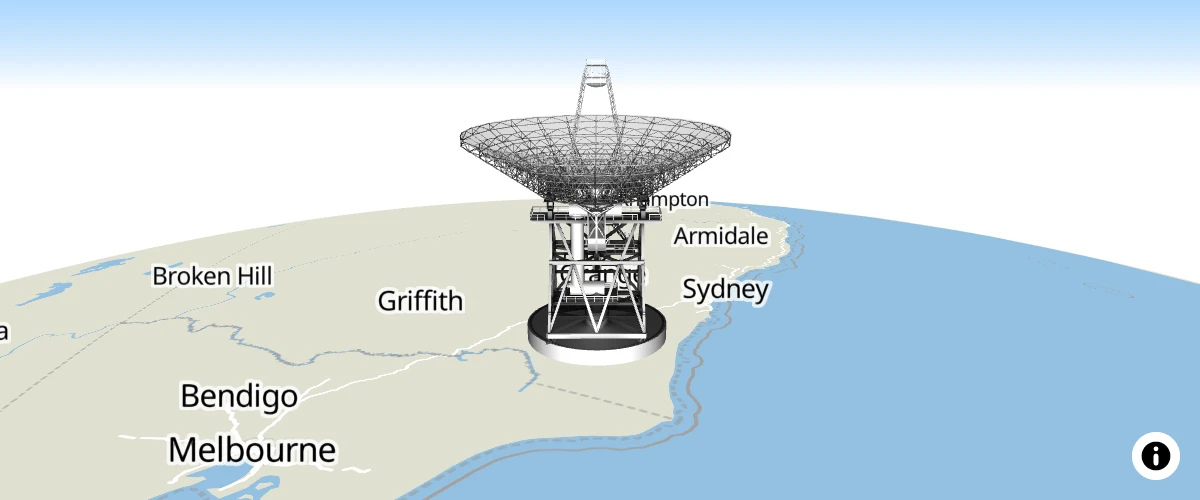
Add a 3D model to globe using three.js
Use a custom style layer with three.js to add a 3D model to a globe.
Add a 3D model with babylon.js
Use a custom style layer with babylon.js to add a 3D model to the map.
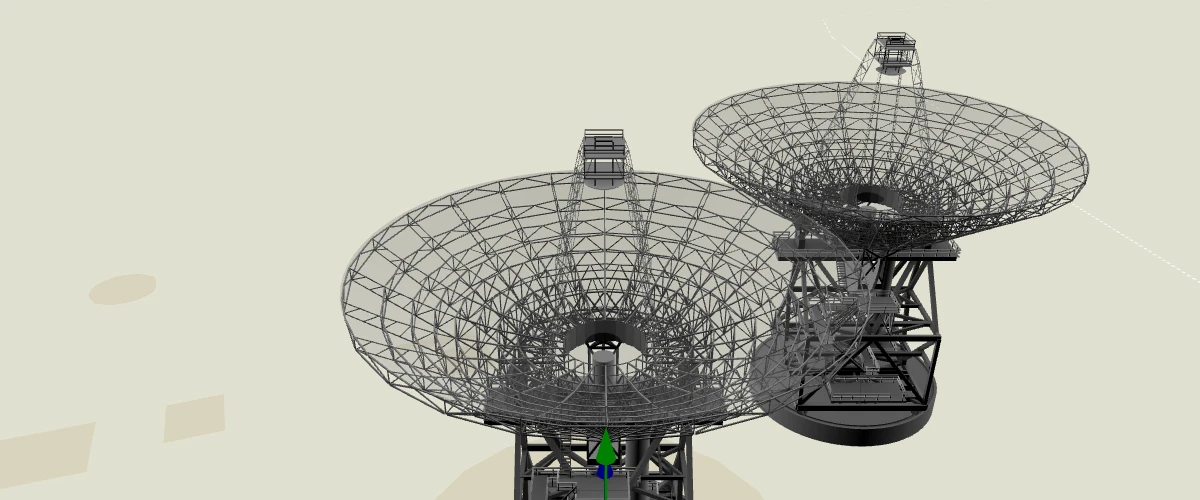
Add a 3D model with shadow using three.js
Use a custom style layer with three.js to add a 3D model with shadow to the map.
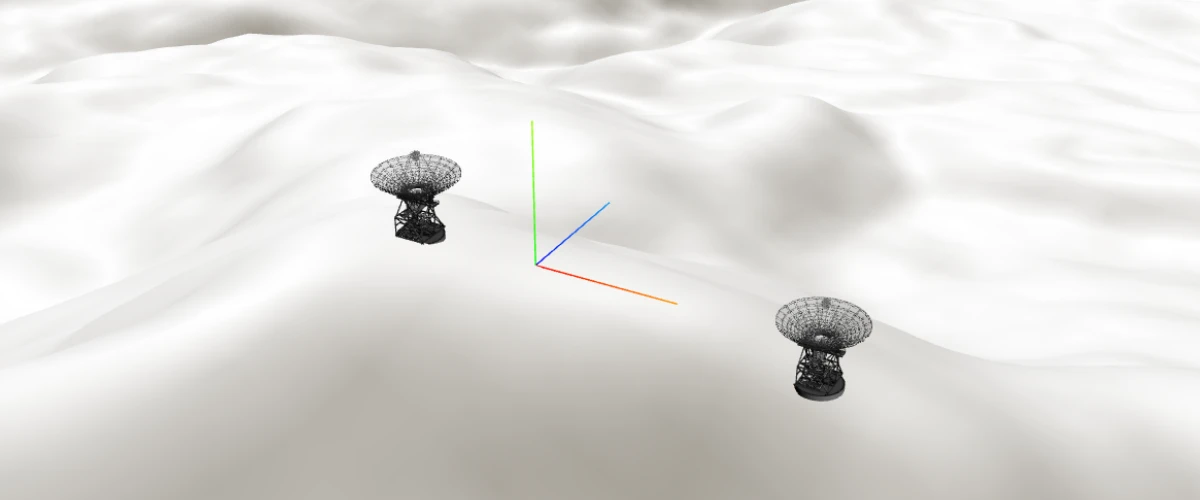
Adding 3D models using three.js on terrain
Use a custom style layer with three.js to add 3D models to a map with 3d terrain.
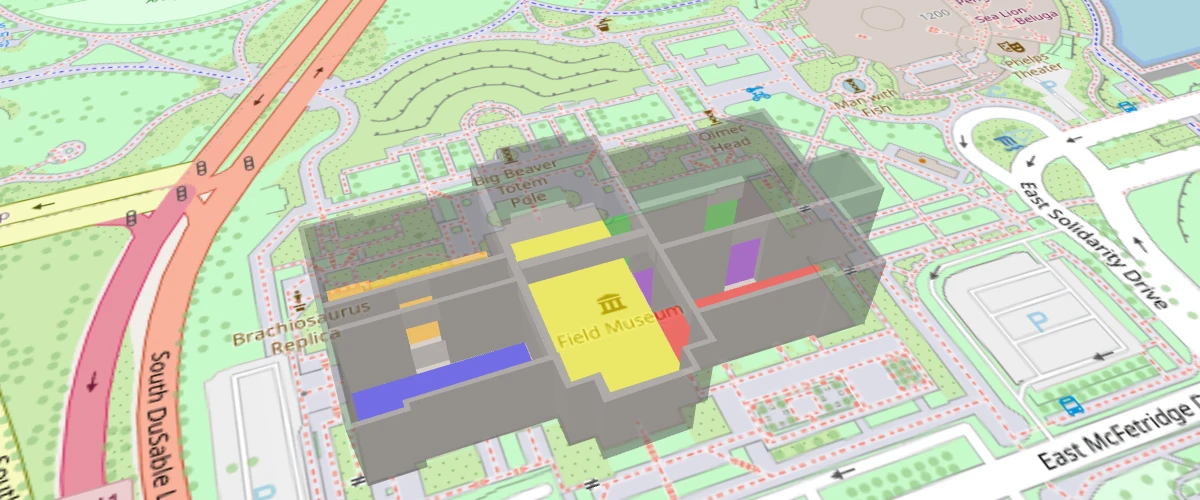
Extrude polygons for 3D indoor mapping
Create a 3D indoor map with the fill-extrude-height paint property.
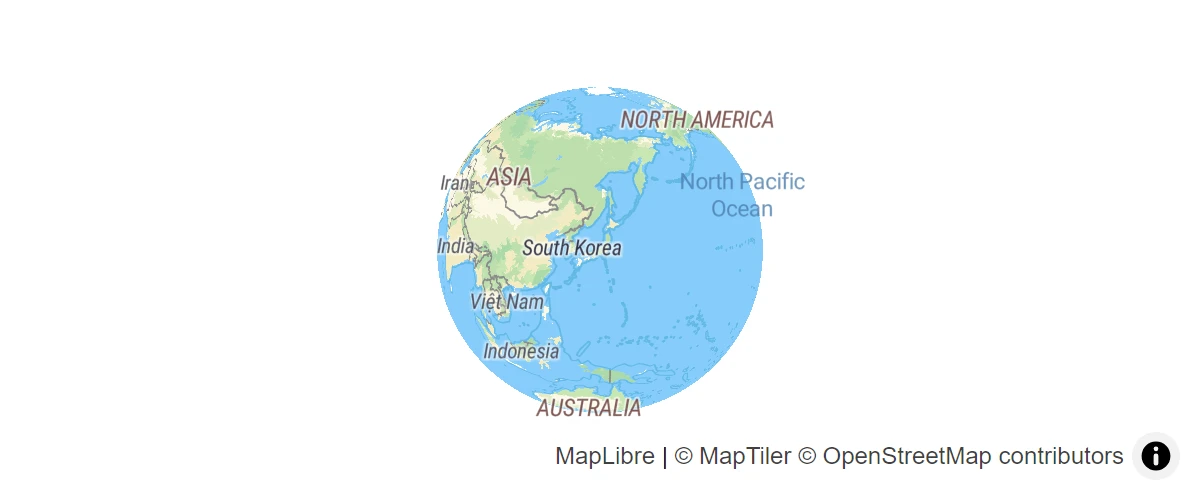
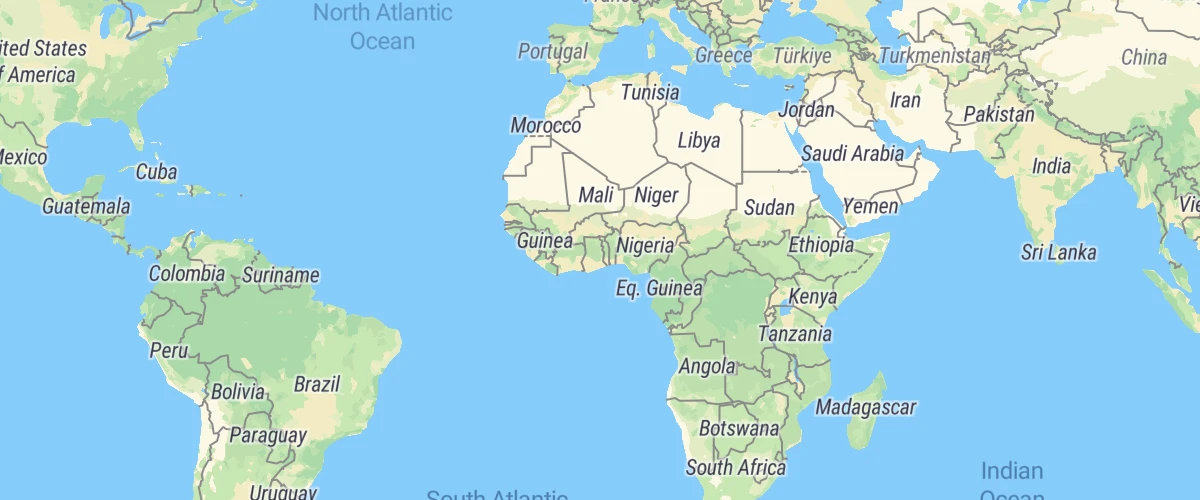
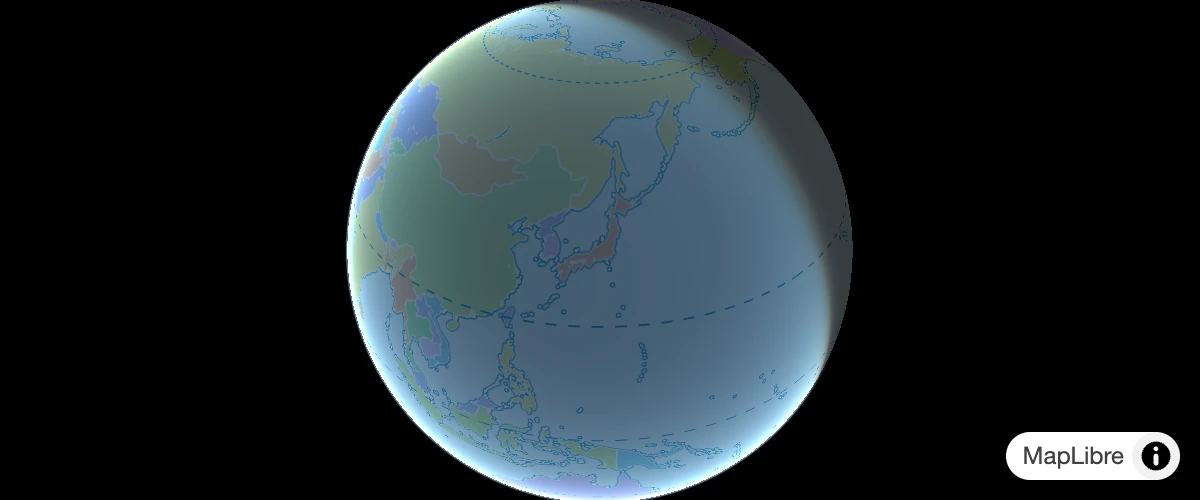
Display a globe with a vector map
Display a globe with a vector map.
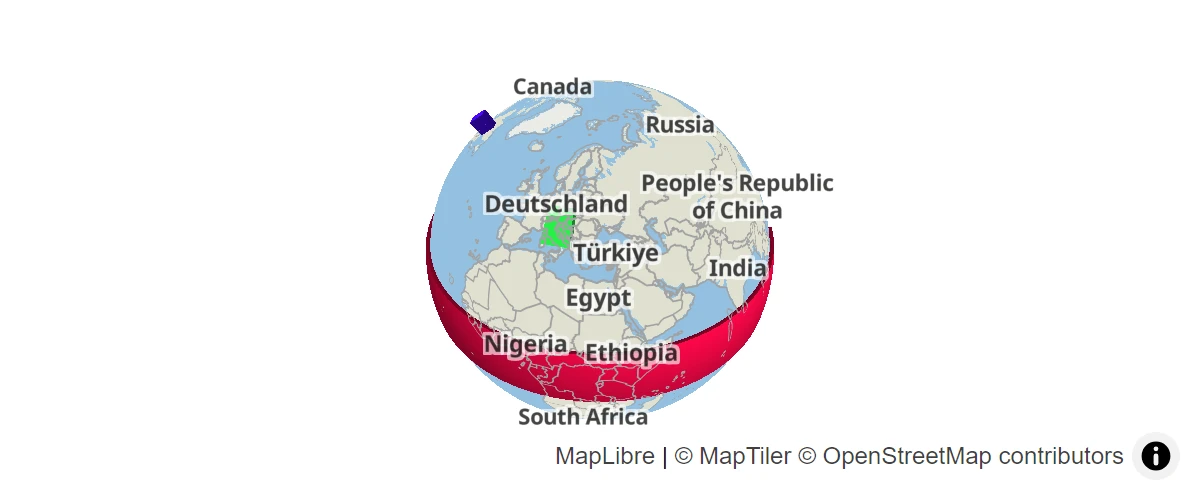
Display a globe with an atmosphere
Display a globe with an atmosphere.
Add a custom layer with tiles to a globe
Use custom layer to display arbitrary tiles drawn with a custom WebGL shader on a globe.
Add a simple custom layer on a globe
Use a custom layer to draw simple WebGL content on a globe.
Create a Heatmap layer on a globe with terrain elevation
Create a Heatmap layer on a globe with terrain elevation.
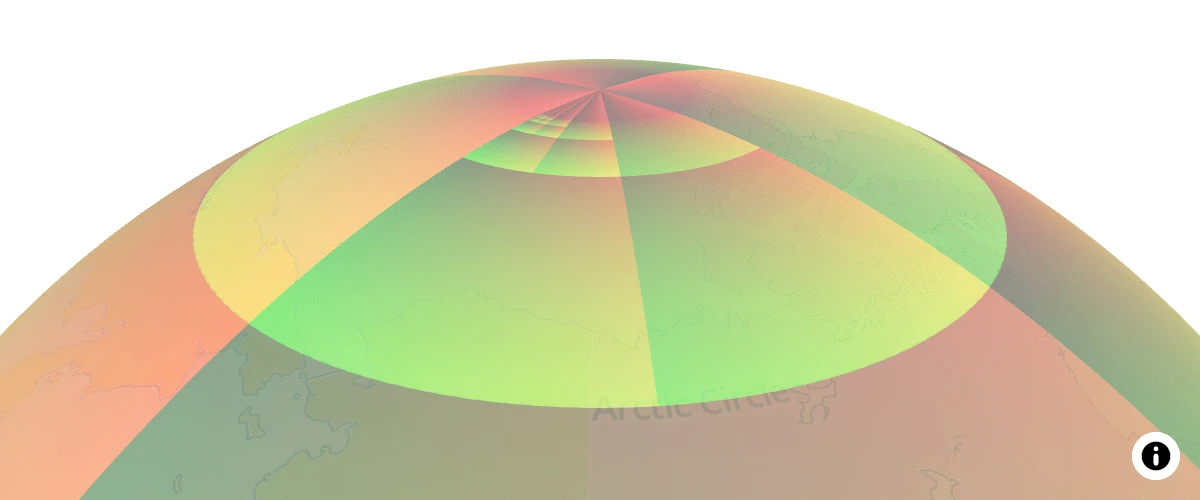
Display a globe with a fill extrusion layer
Display a globe with a fill extrusion layer.
Zoom and planet size relation on globe
Explanation of zoom and planet size relation under globe projection and how to account for it when changing the map center and zoom by some delta.
Annotations & Labels
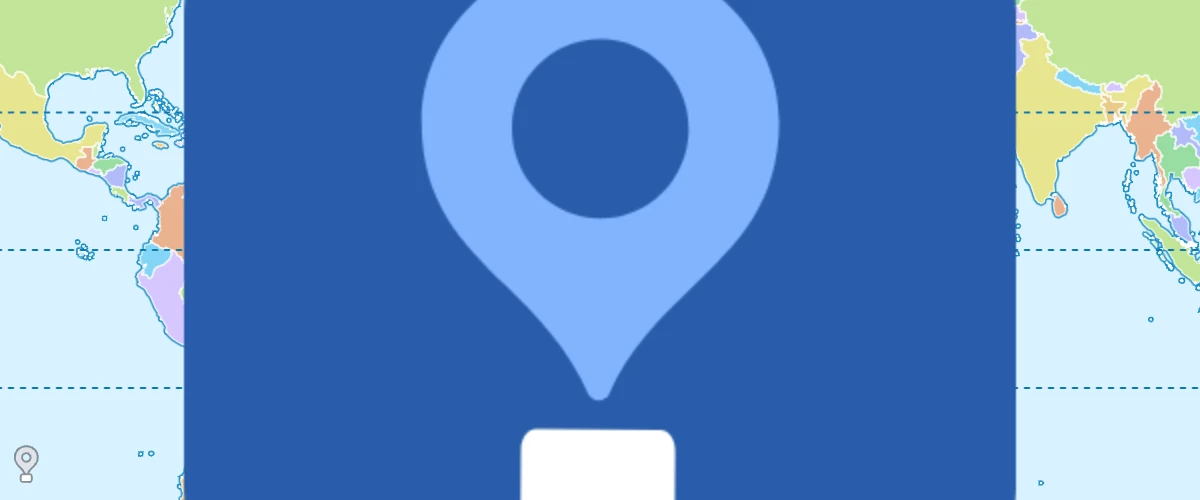
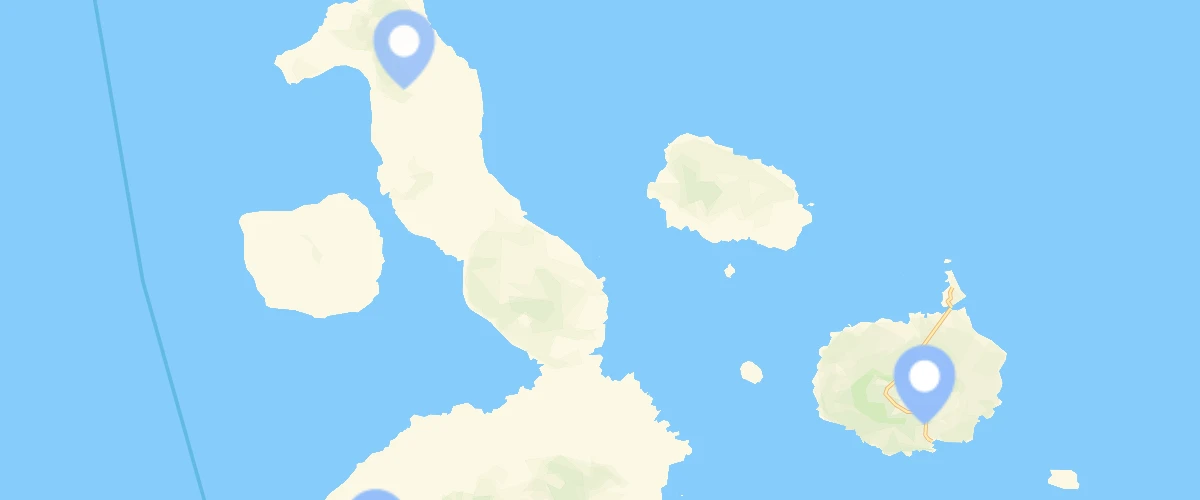
Add a default marker
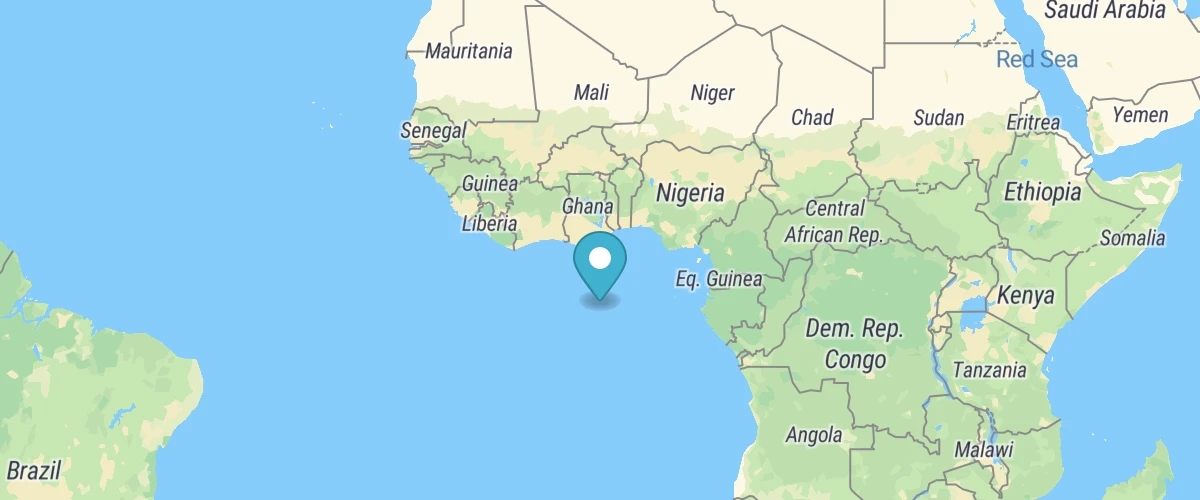
Add a default marker to the map.
Add custom icons with Markers
Add custom marker icons to your map.
Create a draggable Marker
Drag the marker to a new location on a map and populate its coordinates in a display.
Animate a marker
Animate the position of a marker by updating its location on each frame.
Create a draggable point
Drag the point to a new location on a map and populate its coordinates in a display.
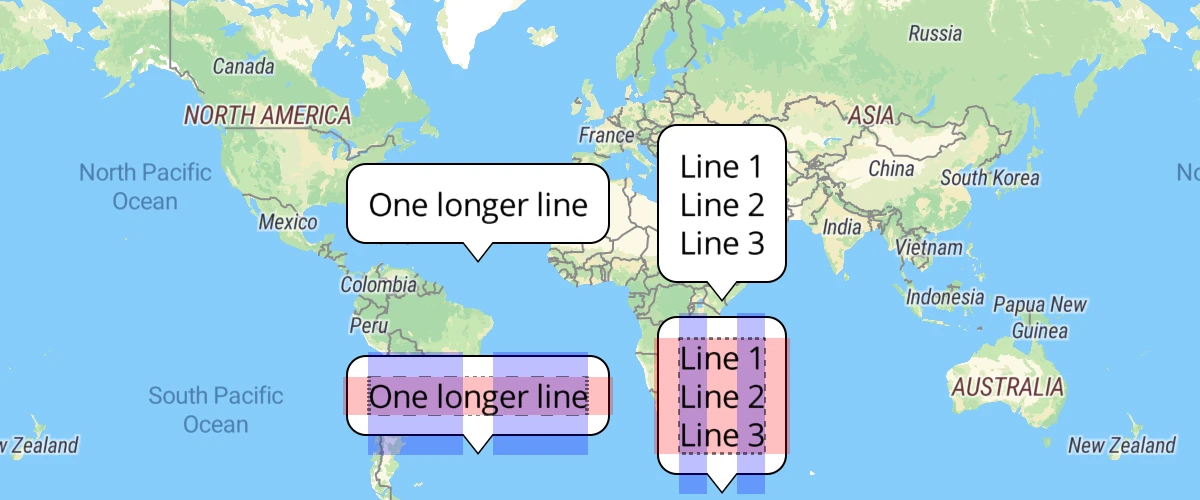
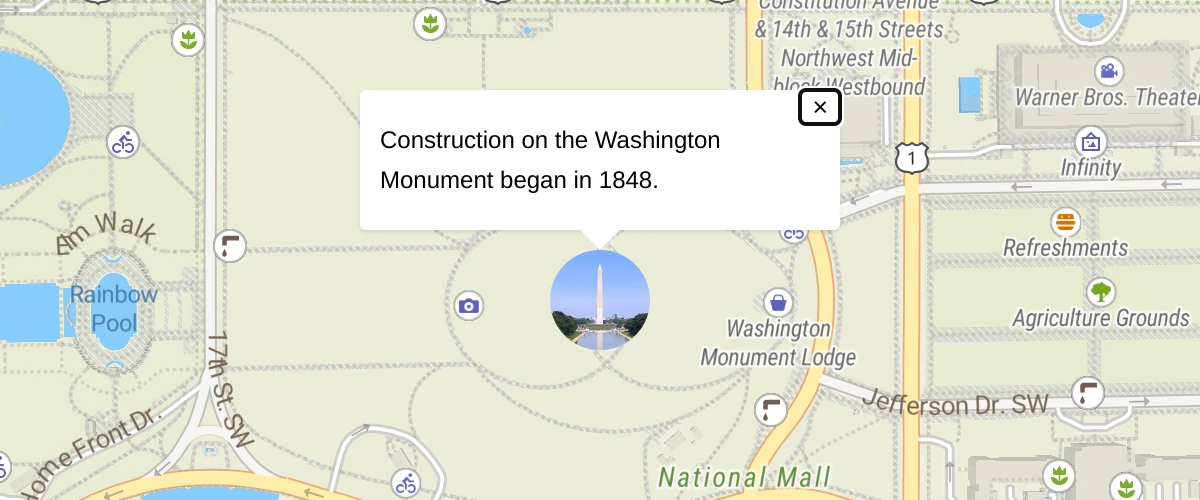
Display a popup
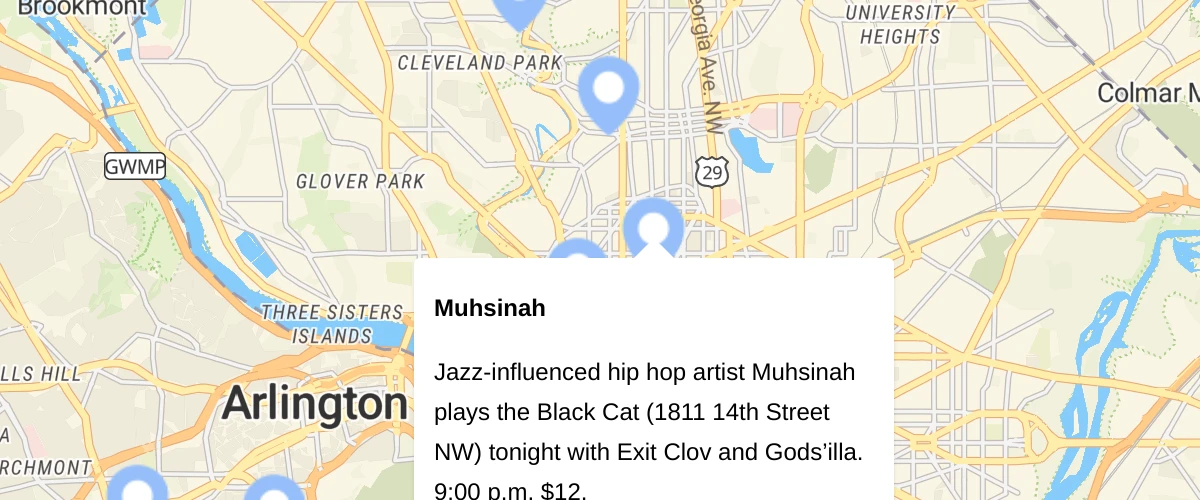
Add a popup to the map.
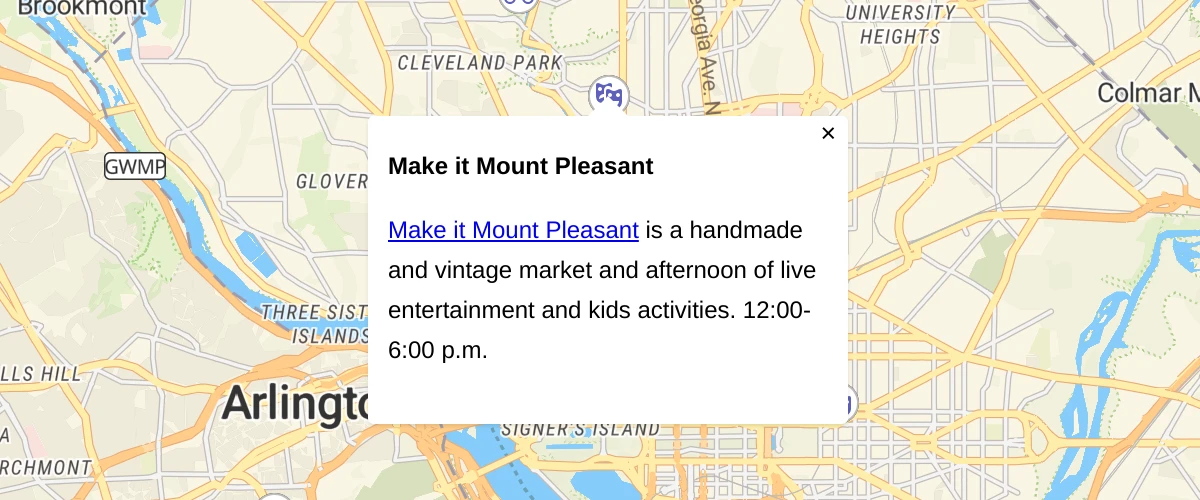
Display a popup on click
When a user clicks a symbol, show a popup containing more information.
Display a popup on hover
When a user hovers over a custom marker, show a popup containing more information.
Attach a popup to a marker instance
Attach a popup to a marker and display it on click.
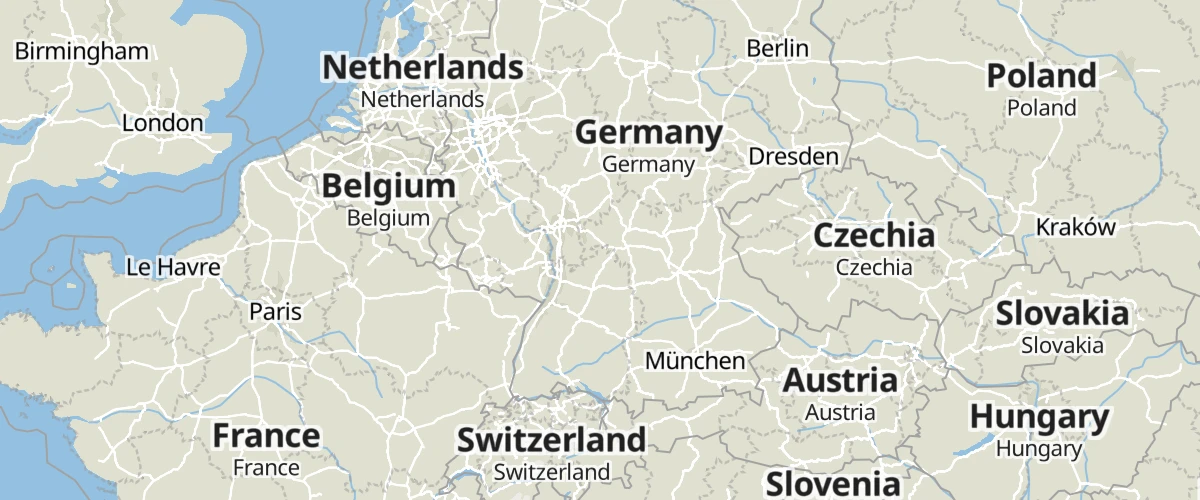
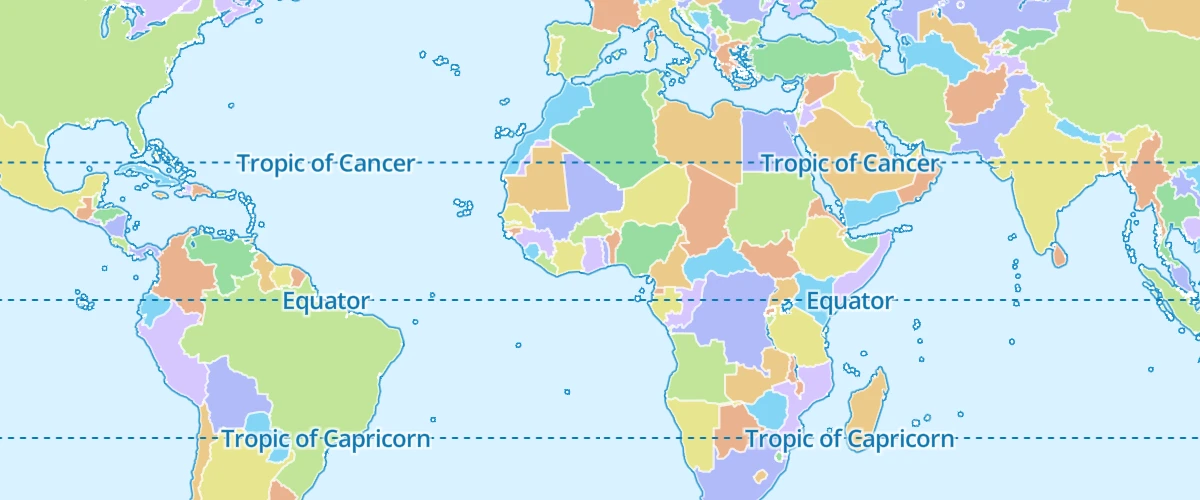
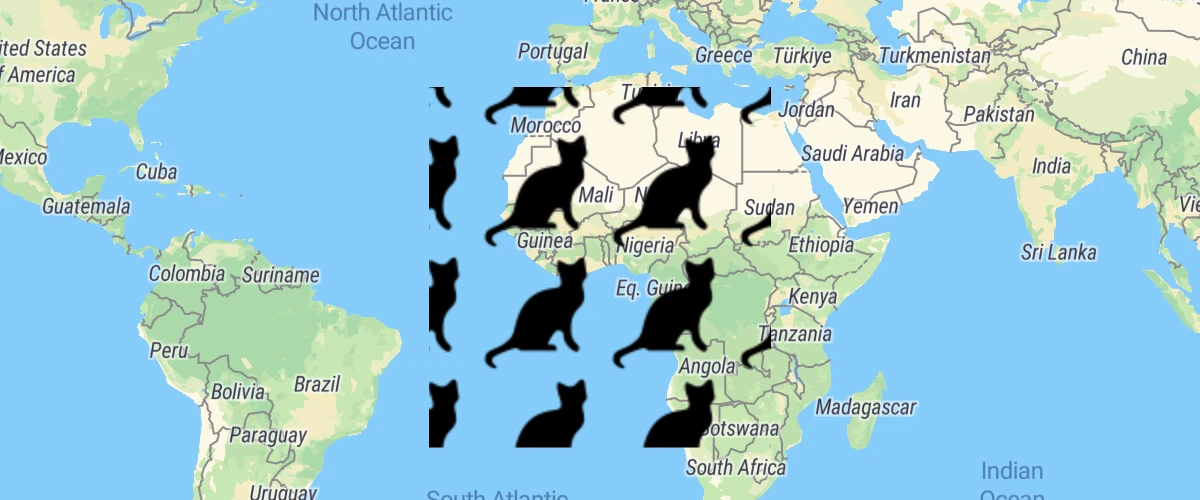
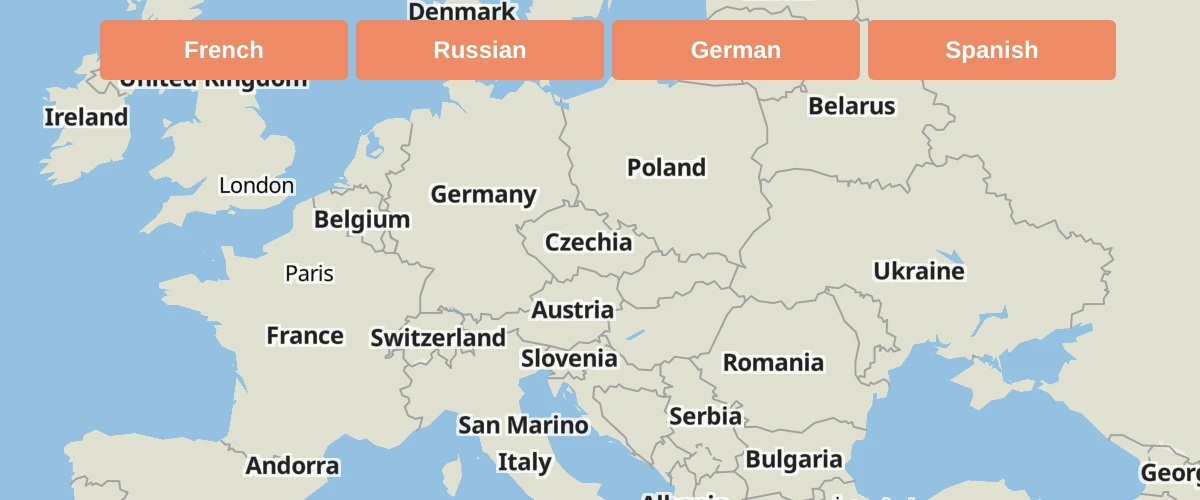
Display and style rich text labels
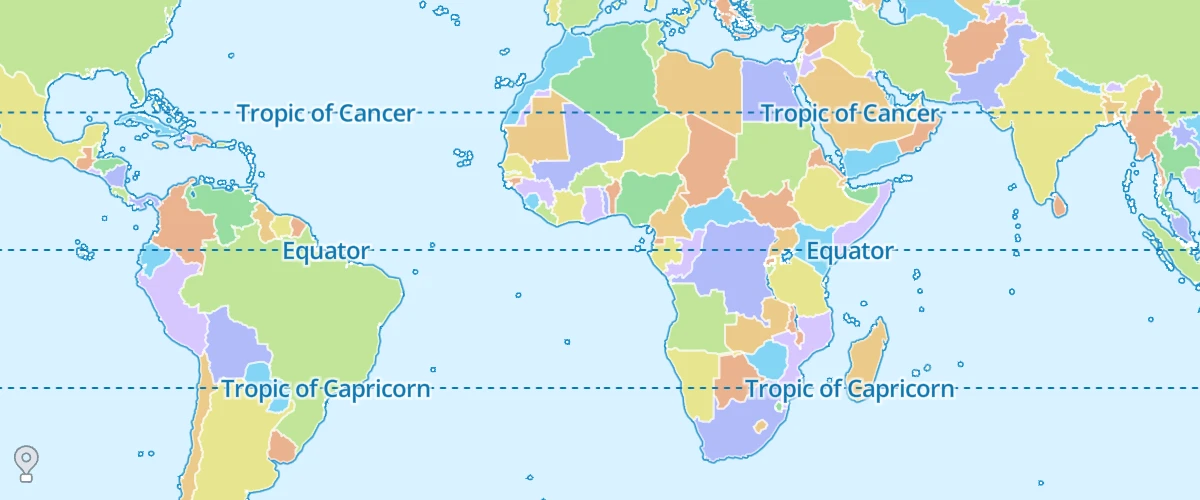
Use the format expression to display country labels in both English and in the local language.
Style labels with Web fonts
Apply Web fonts to your style’s text labels. Unlike signed distance field (SDF) glyph sets, Web fonts are available from a variety of providers, or your can make your own using popular tools. This option is suitable for fonts that are only available through a third-party content delivery network (CDN) for technical or legal reasons, as well as fonts that are incompatible with SDF, such as variable fonts. For compatibility with Android and iOS applications, specify equivalent fonts in the style’s font-faces property.
Change the case of labels
Use the upcase and downcase expressions to change the case of labels.
Style labels with local fonts
Apply local fonts to your style’s text labels. This option is suitable if you don’t need every user to see exactly the same font, or if you want to avoid relying on a third-party content delivery network (CDN). For maximum compatibility, the text-font property should include fonts commonly found on multiple platforms.
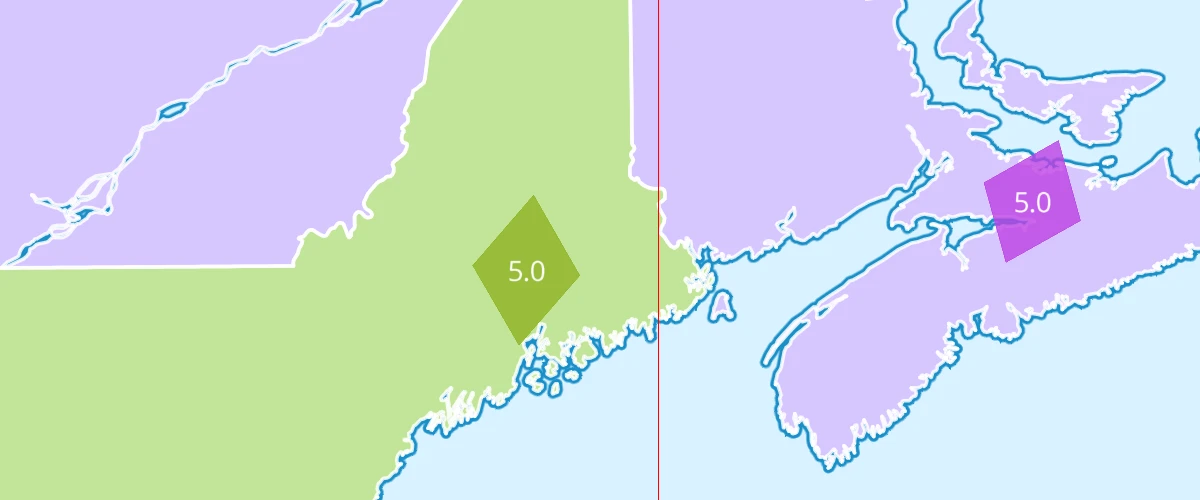
Variable label placement
Use text-variable-anchor to allow high priority labels to shift position to stay on the map.
Variable label placement with offset
Use text-variable-anchor-offset to allow high priority labels to shift position to stay on the map.
Change a map's language
Use setLayoutProperty to switch languages dynamically.
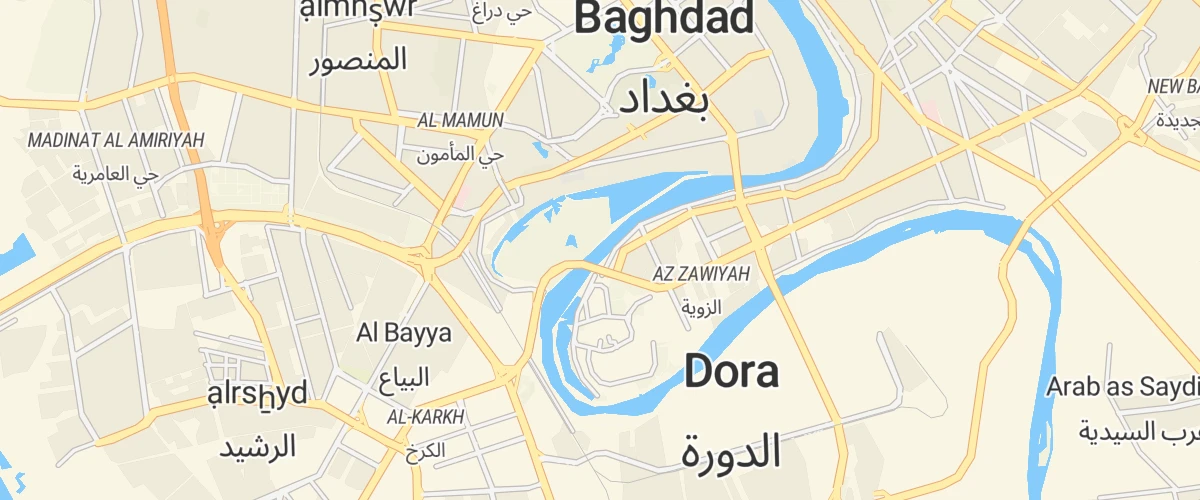
Add support for right-to-left scripts
Use the mapbox-gl-rtl-text plugin to support right-to-left languages such as Arabic and Hebrew.
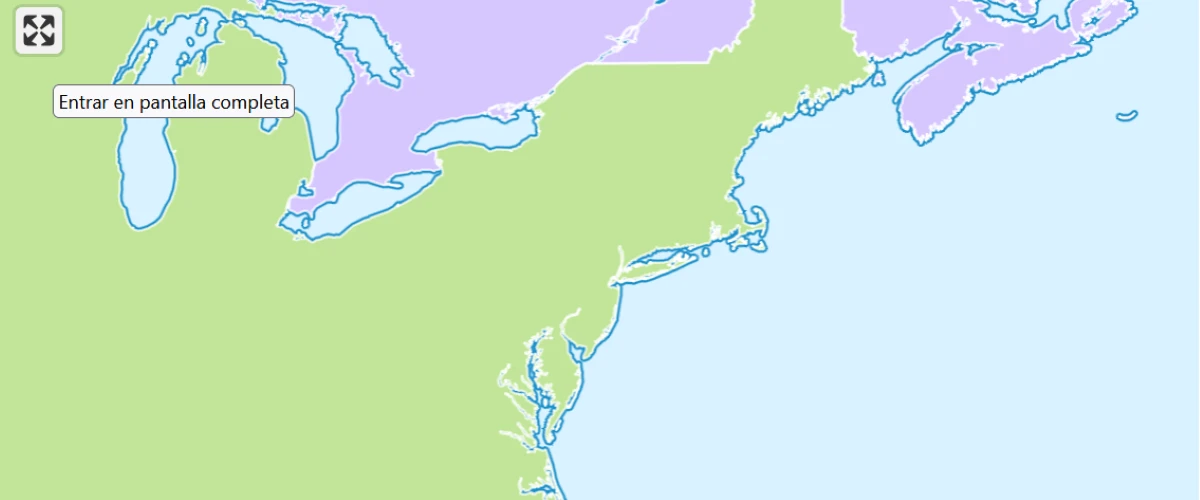
Locale switching
Show how localization can be applied manually to UI elements. Hover over a control to see the translated tooltip.
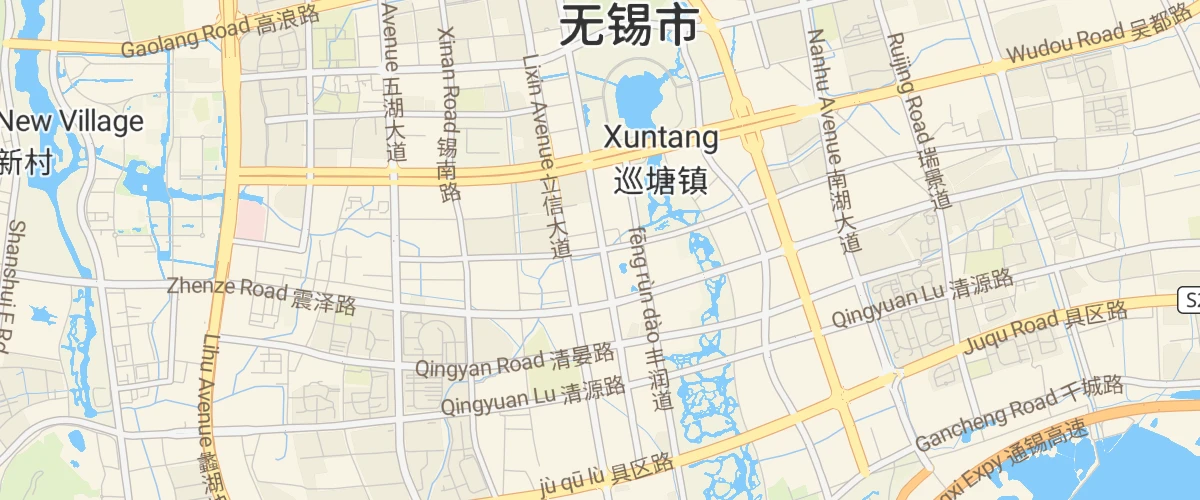
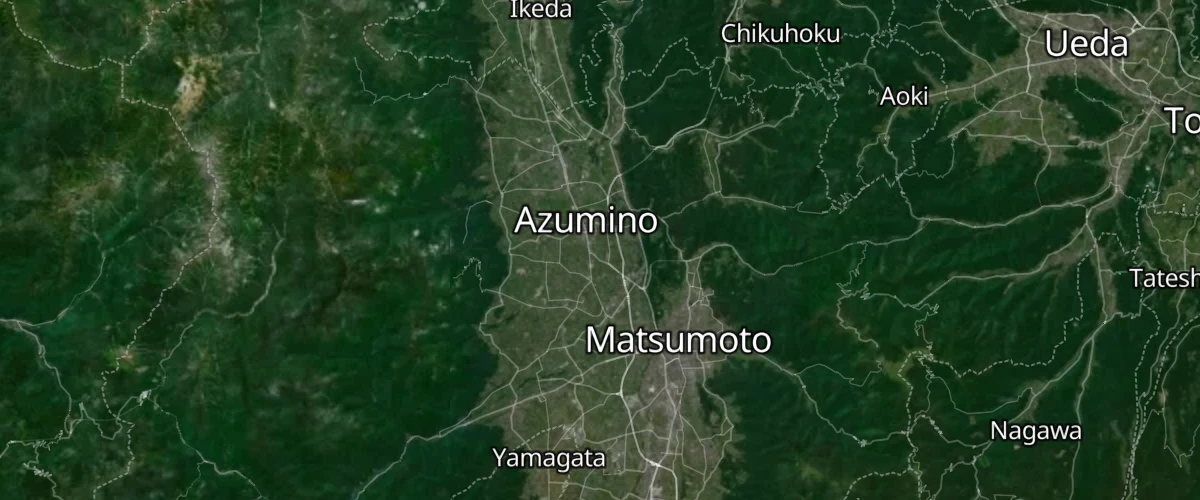
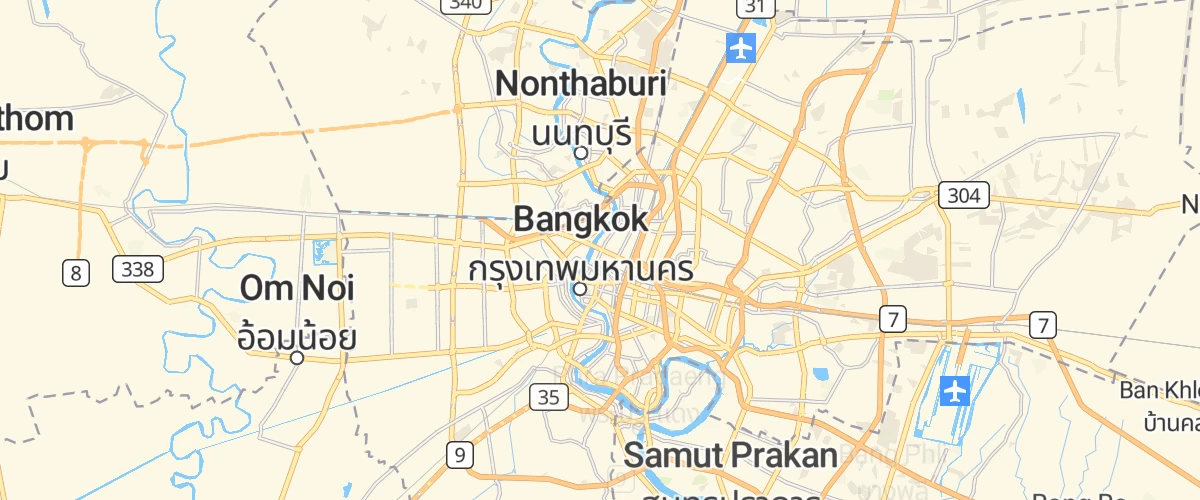
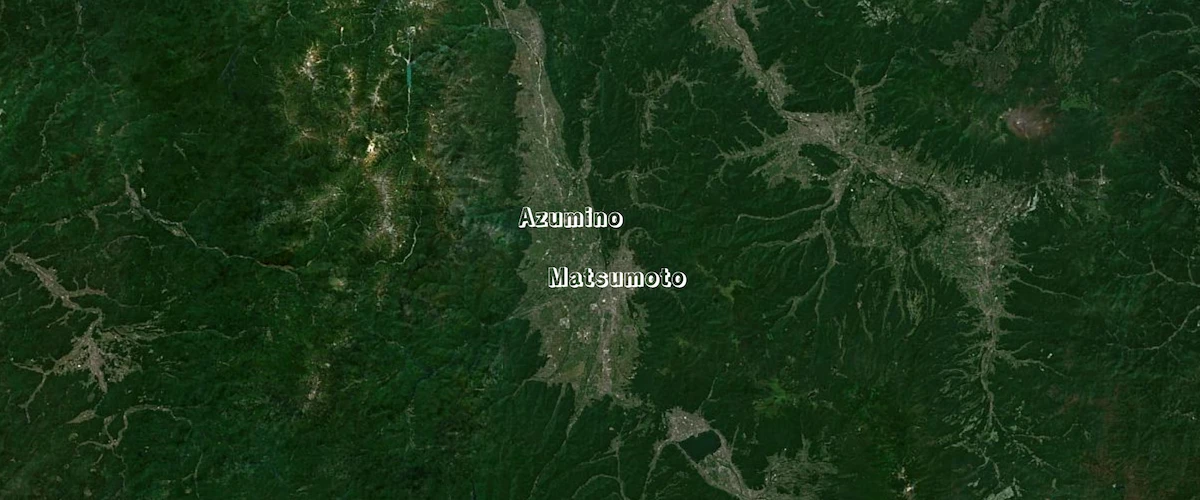
Use locally generated ideographs
Set localIdeographFontFamily to override the font used for displaying CJK (Chinese, Japanese and Korean) characters, ignoring the map style. This setting must be a CSS font rule specifying fallbacks of on-device fonts. Set localIdeographFontFamily to false to use server-provided fonts, which is much slower.
Interactivity & Extensions
Get features under the mouse pointer
Use queryRenderedFeatures to show properties of hovered-over map elements.
Create a hover effect
Use events and feature states to create a per feature hover effect.
Animate symbol to follow the mouse
Animate symbol to follow the mouse.
Center the map on a clicked symbol
Use events and flyTo to center the map on a symbol.
 new
new
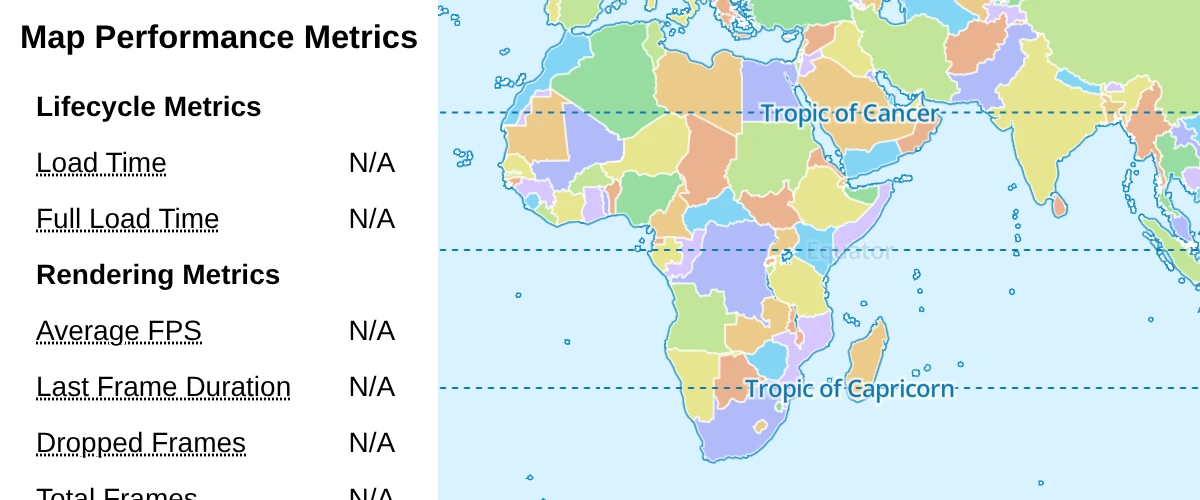
Display Performance Metrics
Measure map performance using built-in events.
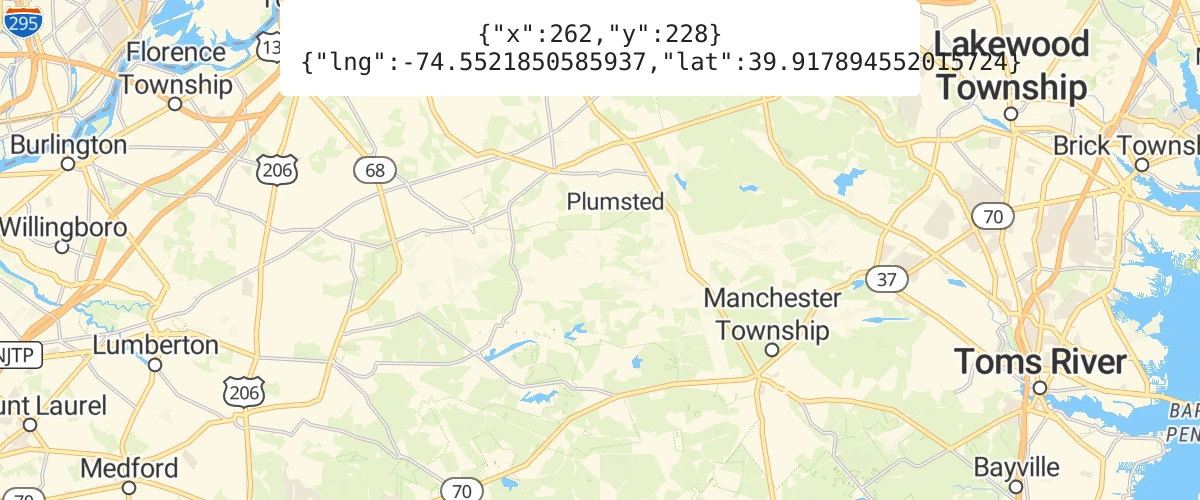
Get coordinates of the mouse pointer
Show mouse position on hover with pixel and latitude and longitude coordinates.
 new
new
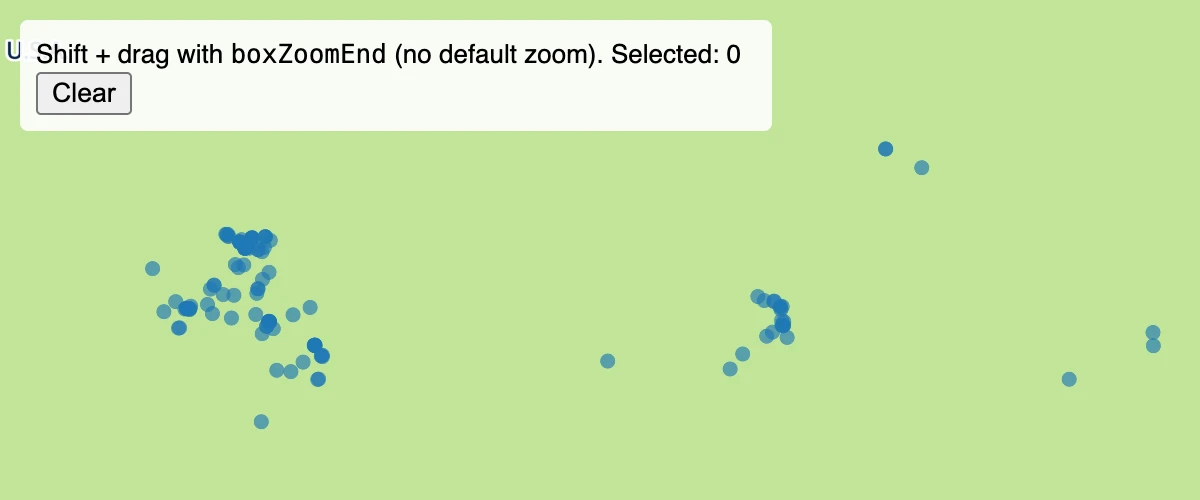
Select features with boxZoomEnd callback
Use the boxZoomEnd callback to select features with Shift-drag instead of fitting the map to the dragged box.
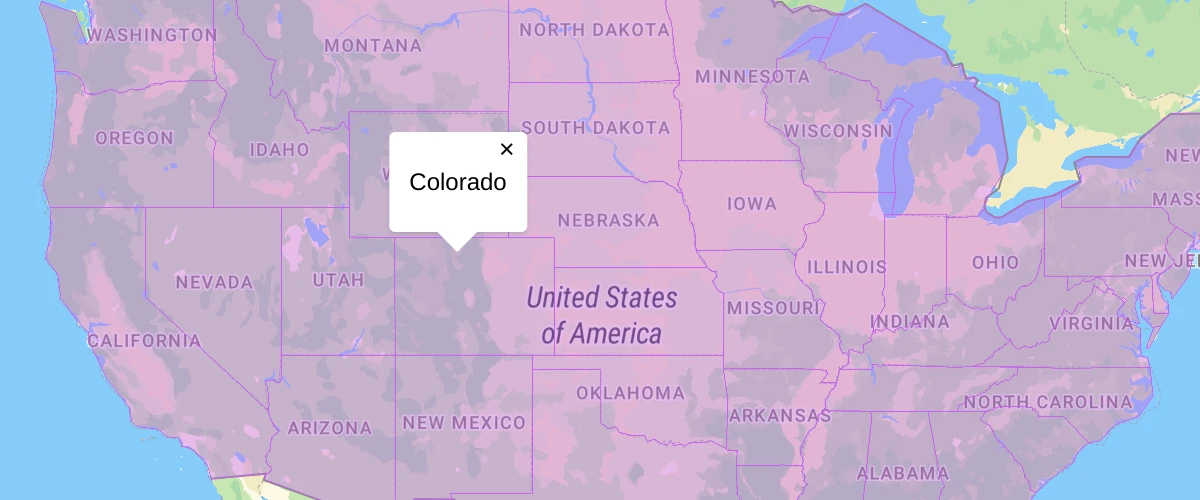
Show polygon information on click
When a user clicks a polygon, show a popup containing more information.
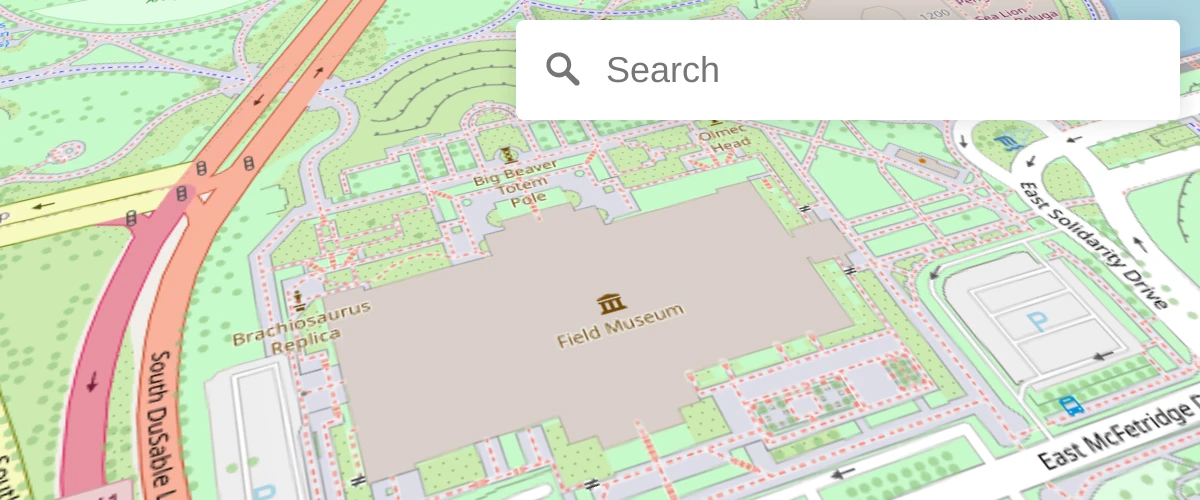
Geocode with Nominatim
Geocode with Nominatim and the maplibre-gl-geocoder plugin.
PMTiles source and protocol
Uses the PMTiles plugin and protocol to present a map.
Create deck.gl layer using REST API
Create a deck.gl layer as an overlay from a REST API.
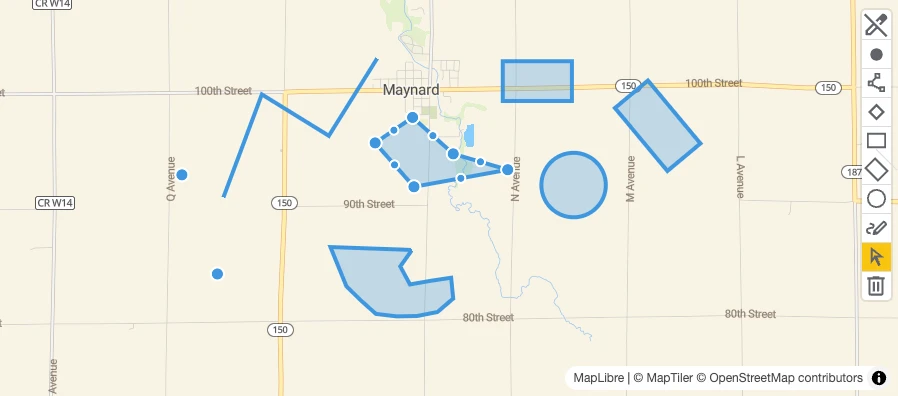
Draw geometries with terra-draw
Use maplibre-gl-terradraw to draw a geometry in various forms such as point, line or polygon on your map.
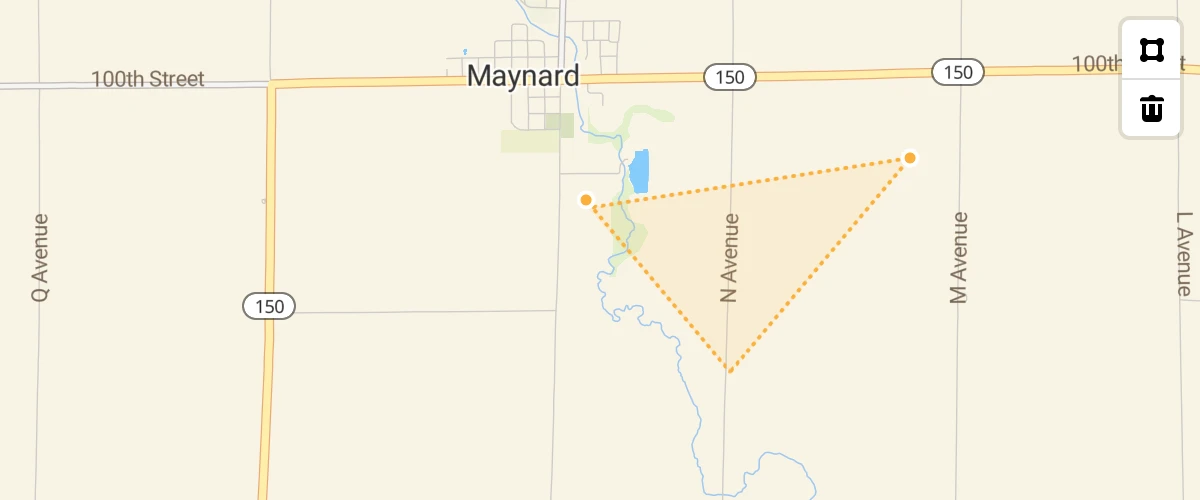
Draw polygon with mapbox-gl-draw
Use mapbox-gl-draw to draw a polygon and Turf.js to calculate its area in square meters.
Sync movement of multiple maps
Synchronize MapLibre GL JS maps with the sync-move plugin.
Toggle deck.gl layer
Toggle deck.gl layer using maplibre.
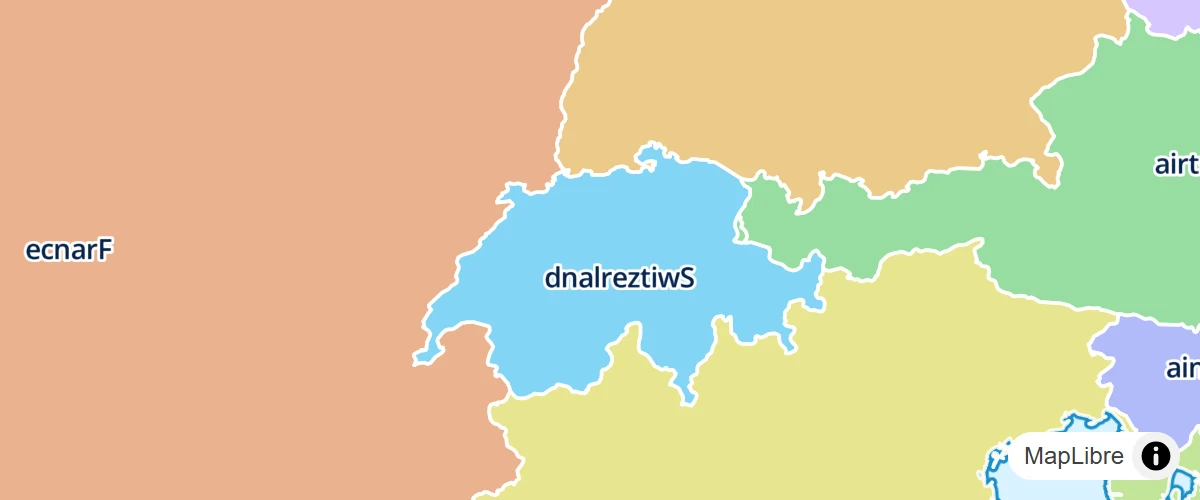
Use addProtocol to Transform Feature Properties
Reverse country names with addProtocol in plain JavaScript.